Economic growth is closely linked to investment. In the short term, there is a demand-side effect: higher investment, by increasing aggregate demand, creates a multiplier effect. GDP rises and unemployment falls. Over the longer term, higher net investment causes a supply-side effect: industrial capacity and potential output rise. This will be from both the greater quantity of capital and, if new investment incorporates superior technology, from a greater productivity of capital.
One of the biggest determinants of investment is certainty about the future: certainty allows businesses to plan investment. Uncertainty, by contrast, is likely to dampen investment. Investment is for future output and if the future is unknown, why undertake costly investment? After all, the cost of investment is generally recouped over several months or year, not immediately. Uncertainty thus increases the risks of investment.
 There is currently great uncertainty in the USA and its trading partners. The frequent changes in policy by President Trump are causing a fall in confidence and consequently a fall in investment. The past few weeks have seen large cuts in US government expenditure as his administration seeks to dismantle the current structure of government. The businesses supplying federal agencies thus face great uncertainty about future contracts. Laid-off workers will be forced to cut their spending, which will have knock-on effect on business, who will cut employment and investment as the multiplier and accelerator work through.
There are also worries that the economic chaos caused by President Trump’s frequent policy changes will cause inflation to rise. Higher inflation will prompt the Federal Reserve to raise interest rates. This, in turn, will increase the cost of borrowing for investment.
Tariff uncertainty
 Perhaps the biggest uncertainty for business concerns the imposition of tariffs. Many US businesses rely on imports of raw materials, components, equipment, etc. Imposing tariffs on imports raises business costs. But this will vary from firm to firm, depending on the proportion of their inputs that are imported. And even when the inputs are from other US companies, those companies may rely on imports and thus be forced to raise prices to their customers. And if, in retaliation, other countries impose tariffs on US goods, this will affect US exporters and discourage them from investing.
For many multinational companies, whether based in the USA or elsewhere, supply chains involve many countries. New tariffs will force them to rethink which suppliers to use and where to locate production. The resulting uncertainty can cause them to delay or cancel investments.
Uncertainty has also been caused by the frequent changes in the planned level of tariffs. With the Trump administration using tariffs as a threat to get trading partners to change policy, the threatened tariff rates have varied depending on how trading partners have responded. There has also been uncertainty on just how the tariff policy will be implemented, making it more difficult for businesses to estimate the effect on them.
Then there are serious issues for the longer term. Other countries will be less willing to sign trade deals with the USA if they will not be honoured. Countries may increasingly look to diverting trade from the USA to other countries.
Video
Articles
- Trump’s erratic trade policies are baffling businesses, threatening investment and economic growth
Associated Press, Paul Wiseman, Anne D’innocenzio and Mae Anderson (6/3/25)
- The world is beginning to tire of Trump’s whiplash leadership
CNN, Stephen Collinson (6/3/25)
- US stocks slide and Nasdaq enters correction as chaos over Trump’s tariffs intensifies
CNN, John Towfighi (6/3/25)
- Trump’s Tariffs And Trade: Uncertainty, Chaos Or Brilliance?
Forbes, Mike Patton (6/3/25)
- How Trump’s second term might affect the market and your finances
The Conversation, Art Durnev (4/3/25)
- US corporate bond investors cautiously navigate trade war uncertainty
Reuters, Matt Tracy (6/3/25)
 This week in Trumponomics: Playing chicken with markets
Yahoo Finance, Rick Newman (8/3/25)
- Measuring fear: What the VIX reveals about market uncertainty
The FRED Blog, Aakash Kalyani (13/2/25)
- Trump shrugs off stock market slump, but economic warning signs loom
The Conversation, Conor O’Kane (17/3/25)
Data
Questions
- Find out what tariffs have been proposed, imposed and changed since Donald Trump came to office on 20 January 2025.
- In what scenario might US investment be stimulated by Donald Trump’s policies?
- What countries’ economies have gained or are set to gain from Donald Trump’s policies?
- What is the USMCA agreement? Do Donald Trump’s policies break this agreement?
- Find out and explain what has happened to the US stock market since January 2025. How do share prices affect business investment?
- Which sector’s shares have risen and which have fallen?
- Using the Data link above, find out what has been happening to the US Policy Uncertainty Index since Donald Trump was elected and explain particular spikes in the index. Is this mirrored in the global Policy Uncertainty Index?
- Are changes in the Policy Uncertainty Index mirrored in the World Uncertainty Index (WUI) and the CBOE Volatility Index: VIX?
 With the onset of the pandemic in early 2020, stock markets around the world fell dramatically, with many indices falling by 30% or more. In the USA, the Dow Jones fell by 37% and the Nasdaq fell by 30%. In the UK, the FTSE 100 fell by 33% and the FTSE 250 by 41%.
But with a combination of large-scale government support for their economies, quantitative easing by central banks and returning confidence of investors, stock markets then made a sustained recovery and have continued to grow strongly since – until recently, that is.

With inflation well above target levels, central banks have ended quantitative easing (QE) or have indicated that they soon will. Interest rates are set to rise, if only slowly. The Bank of England raised Bank Rate from its historic low of 0.1% to 0.25% on 16 December 2021 and ceased QE, having reached its target of £895 billion of asset purchases. On 4 February 2022, it raised Bank Rate to 0.5%. The Fed has announced that it will gradually raise interest rates and will end QE in March 2022, and later in the year could begin selling some of the assets it has purchased (quantitative tightening). The ECB is not ending QE or raising interest rates for the time being, but is likely to do so later in the year.
At the same time economic growth is slowing, leading to fears of stagflation. Governments are likely to dampen growth further by tightening fiscal policy. In the UK, national insurance is set to rise by 1.25 percentage points in April.
The slowdown in growth may discourage central banks from tightening monetary policy more than very slightly. Indeed, in the light of its slowing economy, the Chinese central bank cut interest rates on 20 January 2022. Nevertheless, it is likely that the global trend will be towards tighter monetary policy.
The fears of slowing growth and tighter monetary and fiscal policy have led many stock market investors to predict an end to the rise in stock market prices – an end to the ‘bull run’. This belief was reinforced by growing tensions between Russia and NATO countries and fears (later proved right) that Russia might invade Ukraine with all the turmoil in the global economy that this would entail. Stock market prices have thus fallen.
 The key question is what will investors believe. If they believe that share prices will continue to fall they are likely to sell. This has happened since early January, especially in the USA and especially with stocks in the high-tech sector – such stocks being heavily represented in the Nasdaq composite, a broad-based index that includes over 2500 of the equities listed on the Nasdaq stock exchange. From 3 January to 18 February the index fell from 15 833 to 13 548, a fall of 14.4%. But will this fall be seen as enough to reflect the current economic and financial climate. If so, it could fluctuate around this sort of level.
However, some may speculate that the fall has further to go – that indices are still too high to reflect the earning potential of companies – that the price–earnings ratio is still too high for most shares. If this is the majority view, share prices will indeed fall.
Others may feel that 14.4% is an overcorrection and that the economic climate is not as bleak as first thought and that the Omicron coronavirus variant, being relatively mild for most people, especially if ‘triple jabbed’, may do less economic damage than first feared. In this scenario, especially if the tensions over Ukraine are diffused, people are likely to buy shares while they are temporarily low.
 But a lot of this is second-guessing what other people will do – known as a Keynesian beauty contest situation. If people believe others will buy, they will too and this will push share prices up. If they think others will sell, they will too and this will push share prices down. They will all desperately wish they had a crystal ball as they speculate how people will interpret what central banks, governments and other investors will do.
Articles
Questions
- What changes in real-world factors would drive investors to (a) buy (b) sell shares at the current time?
- How does quantitative easing affect share prices?
- What is meant by the price-earnings ratio of a share? Is it a good indicator as to the likely movement of that share’s price? Explain.
- What is meant by a Keynesian beauty contest? How is it relevant to the stock market?
- Distinguish between stabilising and destabilising speculation and illustrate each with a demand and supply diagram. Explain the concept of overshooting in this context.
- Which is more volatile, the FTSE 100 or the FTSE 250? Explain.
- Read the final article linked above. Were the article’s predictions about the Fed meeting on 26 January borne out? Comment.
 Share prices are determined by demand and supply. The same applies to stock market indices, such as the FTSE 100 and FTSE 250 in the UK and the Dow Jones Industrial Average and the S&P 500 in the USA. After all, the indices are the weighted average prices of the shares included in the index. Generally, when economies are performing well, or are expected to do so, share prices will rise. They are likely to fall in a recession or if a recession is anticipated. A main reason for this is that the dividends paid on shares will reflect the profitability of firms, which tends to rise in times of a buoyant economy.
When it first became clear that Covid-19 would become a pandemic and as countries began locking down, so stock markets plummeted. People anticipated that many businesses would fail and that the likely recession would cause profits of many other surviving firms to decline rapidly. People sold shares.
 The first chart shows how the FTSE 100 fell from 7466 in early February 2020 to 5190 in late March, a fall of 30.5%. The Dow Jones fell by 34% over the same period. In both cases the fall was driven not only by the decline in the respective economy over the period, but by speculation that further declines were to come (click here for a PowerPoint of the chart).
But then stock markets started rising again, especially the Dow Jones, despite the fact that the recessions in the UK, the USA and other countries were gathering pace. In the second quarter of 2020, the Dow Jones rose by 23% and yet the US economy declined by 33% – the biggest quarterly decline on record. How could this be explained by supply and demand?
Quantitative easing
In order to boost aggregate demand and reduce the size of the recession, central banks around the world engaged in large-scale quantitative easing.  This involves central banks buying government bonds and possibly corporate bonds too with newly created money. The extra money is then used to purchase other assets, such as stocks and shares and property, or physical capital or goods and services. The second chart shows that quantitative easing by the Bank of England increased the Bank’s asset holding from April to July 2020 by 50%, from £469bn to £705bn (click here for a PowerPoint of the chart).
But given the general pessimism about the state of the global economy, employment and personal finances, there was little feed-through into consumption and investment. Instead, most of the extra money was used to buy assets. This gave a huge boost to stock markets. Stock market movements were thus out of line with movements in GDP.
Confidence
Stock market prices do not just reflect the current economic and financial situation, but also what people anticipate the situation to be in the future.  As infection and death rates from Covid-19 waned around Europe and in many other countries, so consumer and business confidence rose. This is illustrated in the third chart, which shows industrial, consumer and construction confidence indicators in the EU. As you can see, after falling sharply as the pandemic took hold in early 2020 and countries were locked down, confidence then rose (click here for a PowerPoint of the chart).
But, as infection rates have risen somewhat in many countries and continue to soar in the USA, Brazil, India and some other countries, this confidence may well start to fall again and this could impact on stock markets.
Speculation
 A final, but related, cause of recent stock market movements is speculation. If people see share prices falling and believe that they are likely to fall further, then they will sell shares and hold cash or safer assets instead. This will amplify the fall and encourage further speculation. If, however, they see share prices rising and believe that they will continue to do so, they are likely to want to buy shares, hoping to make a gain by buying them relatively cheaply. This will amplify the rise and, again, encourage further speculation.
If there is a second wave of the pandemic, then stock markets could well fall again, as they could if speculators think that share prices have overshot the levels that reflect the economic and financial situation. But then there may be even further quantitative easing.
There are many uncertainties, both with the pandemic and with governments’ policy responses. These make forecasting stock market movements very difficult. Large gains or large losses could await people speculating on what will happen to share prices.
Articles
Questions
- Illustrate the recent movements of stock markets using demand and supply diagrams. Explain your diagrams.
- What determines the price elasticity of demand for shares?
- Distinguish between stabilising and destabilising speculation. How are the concepts relevant to the recent history of stock market movements?
- Explain how quantitative easing works to increase (a) asset prices; (b) aggregate demand.
- What is the difference between quantitative easing as currently conducted by central banks and ‘helicopter money‘?
- Give some examples of companies whose share prices have risen strongly since March 2020. Explain why these particular shares have done so well.
 On 8 February, the Bank of England issued a statement that was seen by many as a warning for earlier and speedier than previously anticipated increases in the UK base rate. Mark Carney, the governor of the Bank of England, referred in his statement to ‘recent forecasts’ which make it more likely that ‘monetary policy would need to be tightened somewhat earlier and by a somewhat greater extent over the forecast period than anticipated at the time of the November report’.
A similar picture emerges on the other side of the Atlantic. With labour markets continuing to deliver spectacularly high rates of employment (the highest in the last 17 years), there are also now signs that wages are on an upward trajectory. According to a recent report from the US Bureau of Labor Statistics, US wage growth has been stronger than expected, with average hourly earnings rising by 2.9 percent – the strongest growth since 2009.
 These statements have coincided with a week of sharp corrections and turbulence in the world’s largest capital markets, as investors become increasingly conscious of the threat of rising inflation – and the possibility of tighter monetary policy.
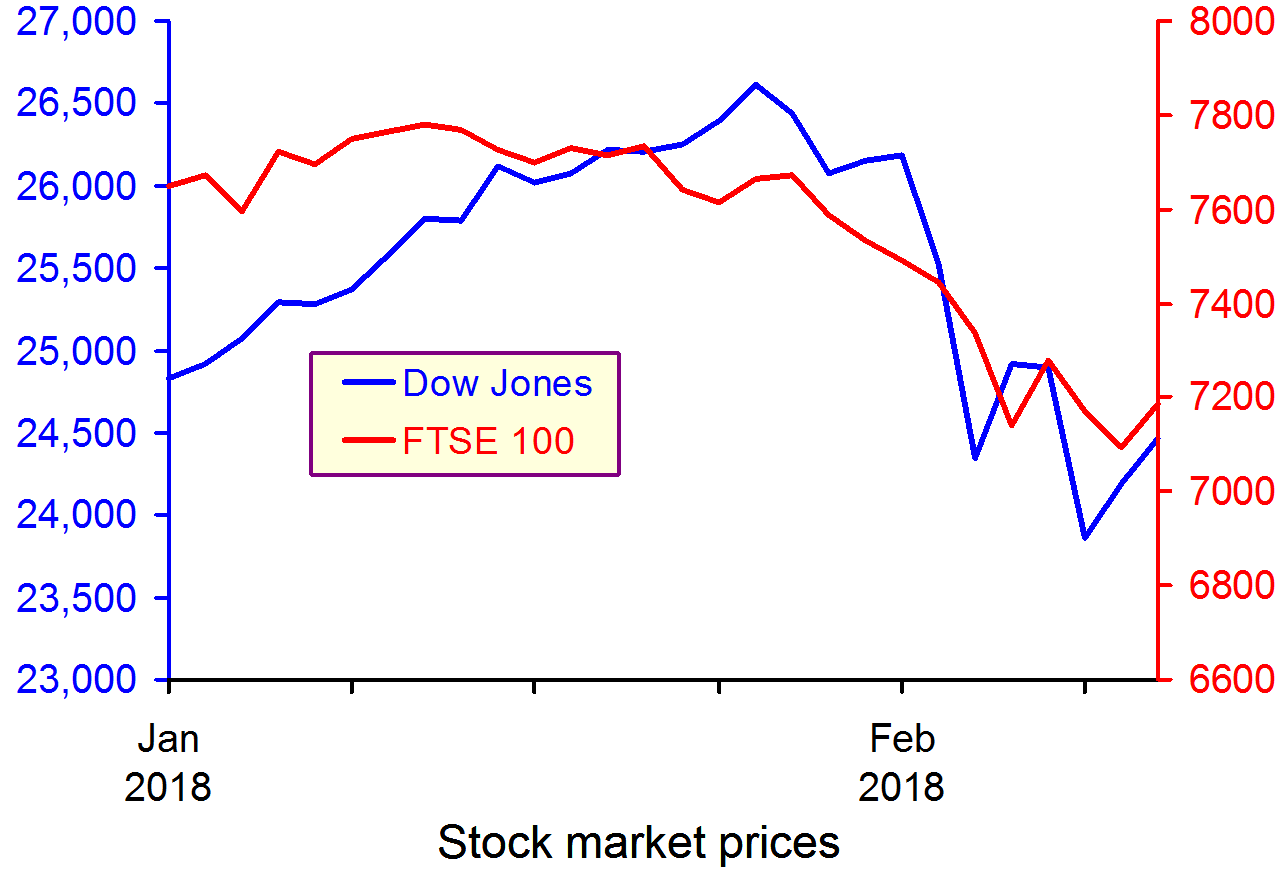
The Dow Jones plunged from an all-time high of 26,186 points on 1 February to 23,860 a week later – losing more than 10 per cent of its value in just five trading sessions (suffering a 4.62 percentag fall on 5 February alone – the worst one-day point fall since 2011). European and Asian markets followed suit, with the FTSE-100, DAX and NIKKEI all suffering heavy losses in excess of 5 per cent over the same period.
 But why should higher inflationary expectations fuel a sell-off in global capital markets? After all, what firm wouldn’t like to sell its commodities at a higher price? Well, that’s not entirely true. Investors know that further increases in inflation are likely to be met by central banks hiking interest rates. This is because central banks are unlikely to be willing or able to allow inflation rates to rise much above their target levels.
The Bank of England, for instance, sets itself an inflation target of 2%. The actual ongoing rate of inflation reported in the latest quarterly Inflation Report is 3% (50 per cent higher than the target rate).
Any increase in interest rates is likely to have a direct impact on both the demand and the supply side of the economy.
Consumers (the demand side) would see their cost of borrowing increase. This could put pressure on households that have accumulated large amounts of debt since the beginning of the recession and could result in lower consumer spending.
Firms (the supply side) are just as likely to suffer higher borrowing costs, but also higher operational costs due to rising wages – both of which could put pressure on profit margins.
It now seems more likely that we are coming towards the end of the post-2008 era – a period that saw the cost of money being driven down to unprecedentedly low rates as the world’s largest economies dealt with the aftermath of the Great Recession.
For some, this is not all bad news – as it takes us a step closer towards a more historically ‘normal’ equilibrium. It remains to be seen how smooth such a transition will be and to what extent the high-leveraged world economy will manage to keep its current pace, despite the increasingly hawkish stance in monetary policy by the world’s biggest central banks.
Video
Dow plunges 1,175 – worst point decline in history CNN Money, Matt Egan (5/2/18)
Articles
Global Markets Shed $5.2 Trillion During the Dow’s Stock Market Correction Fortune, Lucinda Shen (9/2/18)
Bank of England warns of larger rises in interest rates Financial Times, Chris Giles and Gemma Tetlow (8/2/18)
Stocks are now in a correction — here’s what that means Business Insider, Andy Kiersz (8/2/18)
US economy adds 200,000 jobs in January and wages rise at fastest pace since recession Business Insider, Akin Oyedele (2/2/18)
Questions
- Using supply and demand diagrams, explain the likely effect of an increase in interest rates to equilibrium prices and output. Is it good news for investors and how do you expect them to react to such hikes? What other factors are likely to influence the direction of the effect?
- Do you believe that the current ultra-low interest rates could stay with us for much longer? Explain your reasoning.
- What is likely to happen to the exchange rate of the pound against the US dollar, if the Bank of England increases interest rates first?
- Why do stock markets often ‘overshoot’ in responding to expected changes in interest rates or other economic variables
Thirty years ago, on Monday 19 October 1987, stock markets around the world tumbled. The day has been dubbed ‘Black Monday’. Wall Street fell by 22% – its biggest ever one-day fall. The FTSE 100 fell by 10.8% and by a further 12.2% the next day.
The crash caught most people totally by surprise and has never been fully explained. The most likely cause was an excessive rise in the previous three years, when share prices more than doubled. This was combined with the lack of ‘circuit breakers’, which today would prevent excessive selling, and a ‘herd’ effect as people rushed to get out of shares before they fell any further, creating a massive wave of destabilising speculation.
Within a few weeks, share prices started rising again and within three years shares were once again trading at levels before Black Monday.
 Looking back to the events of 30 years ago, the question many fund managers and others are asking is whether global stock markets are in for another dramatic downward correction. But there is no consensus of opinion about the answer.
Those predicting a downward correction – possibly dramatic – point to the fact that stock markets, apart from a dip in mid-2016, have experienced several years of growth, with yields now similar to those in 1987. Price/earnings ratios, at around 18, are high relative to historical averages.
What is more, the huge increases in money supply from quantitative easing, which helped to inflate share prices, are coming to an end. The USA ceased its programme three years ago and the ECB is considering winding down its programme.
Also, once a downward correction starts, destabilising speculation is likely to kick in, with people selling shares before they go any lower. This could be significantly aggravated by the rise of electronic markets with computerised high-frequency trading.
However, people predicting that there will be little or no downward correction, and even a continuing bull market, point to differences between now and 1987. First, the alternatives to shares look much less attractive than then. Bond yields and interest rates in banks (at close to zero), unlike in 1987, are much lower than the dividend yields on shares (at around 4%). Second, there are circuit breakers in stock markets that suspend dealing in cases of large falls.
But even if there is a downward correction, it will probably be relatively short-lived, with the upward trend in share prices continuing over the long term. If you look at the chart above, you can see this trend, but you can also see periods of falling share prices in the late 1990s/early 2000s and in the financial crisis of 2008–9. Looking back to 1987, it seems like a mere blip from the perspective of 30 years – but it certainly didn’t at the time.
Articles
Three decades since Black Monday – are markets on the verge of another tumble? The Telegraph, Lucy Burton (19/10/17)
Black Monday: 30 years on from the 1987 crash Citywire, Michelle McGagh (19/10/17)
30 Years Ago: Lessons From the 1987 Market Crash U.S.News, Debbie Carlson (12/10/17)
Black Monday: Can a 1987-style stock market crash happen again? USA Today, Adam Shell (19/10/17)
Black Monday anniversary: How the 2017 stock market compares with 1987 MarketWatch, William Watts (19/10/17)
30 years after Black Monday, could stock market crash again? MarketWatch, William Watts (19/10/17)
The Crash of ’87, From the Wall Street Players Who Lived It Bloomberg, Richard Dewey (19/10/17)
Questions
- Explain what are meant by ‘bull markets’ and ‘bear markets’.
- Share prices are determined by demand and supply. Identify the various demand- and supply-side factors that have led to the current long bull-market run.
- What caused the Black Monday crash in 1987?
- For what reasons may global stock markets soon (a) experience, (b) not experience a downward correction?
- Distinguish between stabilising speculation and destabilising speculation on stock markets.
- What determines when a downward correction on stock markets bottoms out?
- Explain how stock market circuit breakers work. Can they prevent a fundamental correction?
- Does the rise in computerised trading make a stock market crash more or less likely?