Growth in the eurozone has slowed. The European Central Bank (ECB) now expects it to be 1.1% this year; in December, it had forecast a rate of 1.7% for 2019. Mario Draghi, president of the ECB, in his press conference, said that ‘the weakening in economic data points to a sizeable moderation in the pace of the economic expansion that will extend into the current year’. Faced with a slowing eurozone economy, the ECB has announced further measures to stimulate economic growth.
First it has indicated that interest rates will not rise until next year at the earliest ‘and in any case for as long as necessary to ensure the continued sustained convergence of inflation to levels that are below, but close to, 2% over the medium term’. The ECB currently expects HIPC inflation to be 1.2% in 2019. It was expected to raise interest rates later this year – probably by the end of the summer. The ECB’s main refinancing interest rate, at which it provides liquidity to banks, has been zero since March 2016, and so there was no scope for lowering it.
 Second, although quantitative easing (the asset purchase programme) is coming to an end, there will be no ‘quantitative tightening’. Instead, the ECB will purchase additional assets to replace any assets that mature, thereby leaving the stock of assets held the same. This would continue ‘for an extended period of time past the date when we start raising the key ECB interest rates, and in any case for as long as necessary to maintain favourable liquidity conditions and an ample degree of monetary accommodation’.
Third, the ECB is launching a new series of ‘quarterly targeted longer-term refinancing operations (TLTRO-III), starting in September 2019 and ending in March 2021, each with a maturity of two years’. These are low-interest loans to banks in the eurozone for use for specific lending to businesses and households (other than for mortgages) at below-market rates. Banks will be able to borrow up to 30% of their eligible assets (yet to be fully defined). These, as their acronym suggests, are the third round of such loans. The second round was relatively successful. As the Barron’s article linked below states:
Banks boosted their long-term borrowing from the ECB by 70% over the course of the program, although they did not manage to increase their holdings of business loans until after TLTRO II had finished disbursing funds in March 2017.
Whether these measures will be enough to raise growth rates in the eurozone depends on a range of external factors affecting aggregate demand. Draghi identified three factors which could have a negative effect.
- Brexit. The forecasts assume an orderly Brexit in accordance with the withdrawal deal agreed between the European Commission and the UK government. With the House of Commons having rejected this deal twice, even though it has agreed that there should not be a ‘no-deal Brexit’, this might happen as it is the legal default position. This could have a negative effect on the eurozone economy (as well as a significant one on the UK economy). Even an extension of Article 50 could create uncertainty, which would also have a negative effect
- Trade wars. If President Trump persists with his protectionist policy, this will have a negative effect on growth in the eurozone and elsewhere.
- China. Chinese growth has slowed and this dampens global growth. What is more, China is a major trading partner of the eurozone countries and hence slowing Chinese growth impacts on the eurozone through the international trade multiplier. The ECB has taken this into account, but if Chinese growth slows more than anticipated, this will further push down eurozone growth.
Then there are internal uncertainties in the eurozone, such as the political and economic uncertainty in Italy, which in December 2018 entered a recession (2 quarters of negative economic growth). Its budget deficit is rising and this is creating conflict with the European Commission. Also, there are likely to be growing tensions within Italy as the government raises taxes.
Faced with these and other uncertainties, the measures announced by Mario Draghi may turn out not to be enough. Perhaps in a few months’ there may have to be a further round of quantitative easing.
Articles
- ECB statement following policy meeting
Reuters, Larry King (7/3/19)
- European Central Bank acts to boost struggling eurozone
BBC News, Andrew Walker (7/3/19)
- The European Central Bank Tries to Avoid Repeating Past Mistakes
Barron’s, Matthew C. Klein (8/3/19)
- ECB pushes back rate hike plans, announces fresh funding for banks
CNBC, Silvia Amaro (7/3/19)
- Why the ECB Followed the Fed’s Flip-Flopping
Bloomberg, Mohamed A. El-Erian (7/3/19)
- Central Banks Don’t Have the Answer and Markets Know It
Bloomberg, Robert Burgess (7/3/19)
- Missing out on monetary normalisation
OMFIF, David Marsh (12/4/19)
- The ECB is attempting to get ahead of event
Financial Times, The editorial board (8/3/19)
- Explainer: What is the fuss about European Central Bank TLTRO loans?
Reuters, Balazs Koranyi (4/3/19)
Videos
ECB publications
Questions
- Investigate the history of quantitative easing and its use by the Fed, the Bank of England and the ECB. What is the current position of the three central banks on ‘quantitative tightening’, whereby central banks sell some of the stock of assets they have purchased during the process of quantitative easing or not replace them when they mature?
- What are TLTROs and what use of them has been made by the ECB? Do they involve the creation of new money?
- What will determine the success of the proposed TLTRO III scheme?
- If the remit of central banks is to keep inflation on target, which in the ECB’s case means below 2% HIPC inflation but close to it over the medium term, why do people talk about central banks using monetary policy to revive a flagging economy?
- What is ‘forward guidance’ by central banks and what determines its affect on aggregate demand?
 Ten years ago, the financial crisis deepened and stock markets around the world plummeted. The trigger was the collapse of Lehman Brothers, the fourth-largest US investment bank. It filed for bankruptcy on September 15, 2008. This was not the first bank failure around that time. In 2007, Northern Rock in the UK (Aug/Sept 2007) had collapsed and so too had Bear Stearns in the USA (Mar 2008).
Initially there was some hope that the US government would bail out Lehmans. But when Congress rejected the Bank Bailout Bill on September 29, the US stock market fell sharply, with the Dow Jones falling by 7% the same day. This was mirrored in other countries: the FTSE 100 fell by 15%.
At the core of the problem was excessive lending by banks with too little capital. What is more, much of the capital was of poor quality. Many of the banks held securitised assets containing ‘sub-prime mortgage debt’. The assets, known as collateralised debt obligations (CDOs), were bundles of other assets, including mortgages. US homeowners had been lent money based on the assumption that their houses would increase in value. When house prices fell, homeowners were left in a position of negative equity – owing more than the value of their house. With many people forced to sell their houses, prices fell further. Mortgage debt held by banks could not be redeemed: it was ‘sub-prime’ or ‘toxic debt’.
Response to the crisis
The outcome of the financial crash was a series of bailouts of banks around the world. Banks cut back on lending and the world headed for a major recession.
Initially, the response of governments and central banks was to stimulate their economies through fiscal and monetary policies. Government spending was increased; taxes were cut; interest rates were cut to near zero. By 2010, the global economy seemed to be pulling out of recession.
However, the expansionary fiscal policy, plus the bailing out of banks, had led to large public-sector deficits and growing public-sector debt. Although a return of economic growth would help to increase revenues, many governments felt that the size of the public-sector deficits was too large to rely on economic growth.
As a result, many governments embarked on a period of austerity – tight fiscal policy, involving cutting government expenditure and raising taxes. Although this might slowly bring the deficit down, it slowed down growth and caused major hardships for people who relied on benefits and who saw their benefits cut. It also led to a cut in public services.
 Expanding the economy was left to central banks, which kept monetary policy very loose. Rock-bottom interest rates were then accompanied by quantitative easing. This was the expansion of the money supply by central-bank purchases of assets, largely government bonds. A massive amount of extra liquidity was pumped into economies. But with confidence still low, much of this ended up in other asset purchases, such as stocks and shares, rather than being spent on goods and services. The effect was a limited stimulation of the economy, but a surge in stock market prices.
With wages rising slowly, or even falling in real terms, and with credit easy to obtain at record low interest rates, so consumer debt increased.
Lessons
So have the lessons of the financial crash been learned? Would we ever have a repeat of 2007–9?
On the positive side, financial regulators are more aware of the dangers of under capitalisation. Banks’ capital requirements have increased, overseen by the Bank for International Settlements. Under its Basel II and then Basel III regulations (see link below), banks are required to hold much more capital (‘capital buffers’). Some countries’ regulators (normally the central bank), depending on their specific conditions, exceed these the Basel requirements.
But substantial risks remain and many of the lessons have not been learnt from the financial crisis and its aftermath.
There has been a large expansion of household debt, fuelled by low interest rates. This constrains central banks’ ability to raise interest rates without causing financial distress to people with large debts. It also makes it more likely that there will be a Minsky moment, when a trigger, such as a trade war (e.g. between the USA and China), causes banks to curb lending and consumers to rein in debt. This can then lead to a fall in aggregate demand and a recession.
Total debt of the private and public sectors now amounts to $164 trillion, or 225% of world GDP – 12 percentage points higher than in 2009.
China poses a considerable risk, as well as being a driver of global growth. China has very high levels of consumer debt and many of its banks are undercapitalised. It has already experienced one stock market crash. From mid-June 2015, there was a three-week fall in share prices, knocking about 30% off their value. Previously the Chinese stock market had soared, with many people borrowing to buy shares. But this was a classic bubble, with share prices reflecting exuberance, not economic fundamentals.
Although Chinese government purchases of shares and tighter regulation helped to stabilise the market, it is possible that there may be another crash, especially if the trade war with the USA escalates even further. The Chinese stock market has already lost 20% of its value this year.
Then there is the problem with shadow banking. This is the provision of loans by non-bank financial institutions, such as insurance companies or hedge funds. As the International Business Times article linked below states:
A mind-boggling study from the US last year, for example, found that the market share of shadow banking in residential mortgages had rocketed from 15% in 2007 to 38% in 2015. This also represents a staggering 75% of all loans to low-income borrowers and risky borrowers. China’s shadow banking is another major concern, amounting to US$15 trillion, or about 130% of GDP. Meanwhile, fears are mounting that many shadow banks around the world are relaxing their underwriting standards.
Another issue is whether emerging markets can sustain their continued growth, or whether troubles in the more vulnerable emerging-market economies could trigger contagion across the more exposed parts of the developing world and possibly across the whole global economy. The recent crises in Turkey and Argentina may be a portent of this.
 Then there is a risk of a cyber-attack by a rogue government or criminals on key financial insitutions, such as central banks or major international banks. Despite investing large amounts of money in cyber-security, financial institutions worry about their vulnerability to an attack.
Any of these triggers could cause a crisis of confidence, which, in turn, could lead to a fall in stock markets, a fall in aggregate demand and a recession.
Finally there is the question of the deep and prolonged crisis in capitalism itself – a crisis that manifests itself, not in a sudden recession, but in a long-term stagnation of the living standards of the poor and ‘just about managing’. Average real weekly earnings in many countries today are still below those in 2008, before the crash. In Great Britain, real weekly earnings in July 2018 were still some 6% lower than in early 2008.
Articles
- The Lehman Brothers Crash And The Chaos That Followed – Everything You Need To Know
HuffPost, Isabel Togoh (15/9/18)
- Ten years after the crash: have the lessons of Lehman been learned?
The Guardian, Yanis Varoufakis, Ann Pettifor, Mark Littlewood, David Blanchflower, Olli Rehn, Nicky Morgan and Micah White (14/9/18)
- Financial crisis 10 years on: Who are the winners and losers?
Independent, Kate Hughes (14/9/18)
- Investment winners and losers 10 years after the crash
Financial Times, Kate Beioley (14/9/18)
- Nine Lessons From the Global Financial Crisis
Bloomberg, Mohamed A. El-Erian (13/9/18)
- Lehman — why we need a change of mindset
Deutsche Welle, Thomas Straubhaar (14/9/18)
- ‘The world is sleepwalking into a financial crisis’ – Gordon Brown
The Guardian, Larry Elliott (12/9/18)
 Economists warn of new financial crisis on anniversary of 2008 crash
Channel 4 news, Helia Ebrahimi (15/9/18)
- Financial crisis 2008: Five biggest risks of a new crash
International Business Times, Nafis Alam (14/9/18)
- Carney warns against complacency on 10th anniversary of financial crisis
BBC News, Kamal Ahmed (12/9/18)
- A cyberattack could trigger the next financial crisis, new report says
CNBC, Bob Pisani (13/9/18)
Information and data
Questions
- Explain the major causes of the financial market crash in 2008.
- Would it have been a good idea to have continued with expansionary fiscal policy beyond 2009?
- Summarise the Basel III banking regulations.
- How could quantitative easing have been differently designed so as to have injected more money into the real sector of the economy?
- What are the main threats to the global economy at the current time? Are any of these a ‘hangover’ from the 2007–8 financial crisis?
- What is meant by ‘shadow banking’ and how might this be a threat to the future stability of the global economy?
- Find data on household debt in two developed countries from 2000 to the present day. Chart the figures. Explain the pattern that emerges and discuss whether there are any dangers for the two economies from the levels of debt.
 The last two weeks have been quite busy for macroeconomists, HM Treasury staff and statisticians in the UK. The Chancellor of the Exchequer, Mr Phillip Hammond, delivered his (fairly upbeat) Spring Budget Statement on 13 March, highlighting among other things the ‘stellar performance’ of UK labour markets. According to a Treasury Press Release:
Employment has increased by 3 million since 2010, which is the equivalent of 1,000 people finding work every day. The unemployment rate is close to a 40-year low. There is also a joint record number of women in work – 15.1 million. The OBR predict there will be over 500,000 more people in work by 2022.
To put these figures in perspective, according to recent ONS estimates, in January 2018 the rate of UK unemployment was 4.3 per cent – down from 4.4 per cent in December 2017. This is the lowest it has been since 1975. This is of course good news: a thriving labour market is a prerequisite for a healthy economy and a good sign that the UK is on track to full recovery from its 2008 woes.
The Bank of England welcomed the news with a mixture of optimism and relief, and signalled that the time for the next interest rate hike is nigh: most likely at the next MPC meeting in May.
But what is the practical implication of all this for UK consumers and workers?

For workers it means it’s a ‘sellers’ market’: as more people get into employment, it becomes increasingly difficult for certain sectors to fill new vacancies. This is pushing nominal wages up. Indeed, UK wages increased on average by 2.6 per cent year-to-year.
In real terms, however, wage growth has not been high enough to outpace inflation: real wages have fallen by 0.2 per cent compared to last year. Britain has received a pay rise, but not high enough to compensate for rising prices. To quote Matt Hughes, a senior ONS statistician:
Employment and unemployment levels were both up on the quarter, with the employment rate returning to its joint highest ever. ‘Economically inactive’ people — those who are neither working nor looking for a job — fell by their largest amount in almost five and a half years, however. Total earnings growth continues to nudge upwards in cash terms. However, earnings are still failing to outpace inflation.
An increase in interest rates is likely to put further pressure on indebted households. Even more so as it coincides with the end of the five-year grace period since the launch of the 2013 Help-to-Buy scheme, which means that many new homeowners who come to the end of their five year fixed rate deals, will soon find themselves paying more for their mortgage, while also starting to pay interest on their Help-to-buy government loan.
Will wages grow fast enough in 2018 to outpace inflation (and despite Brexit, which is now only 12 months away)? We shall see.
Articles
Data, Reports and Analysis
Questions
- What is monetary policy, and how is it used to fine tune the economy?
- What is the effect of an increase in interest rates on aggregate demand?
- How optimistic (or pessimistic) are you about the UK’s economic outlook in 2018? Explain your reasoning.
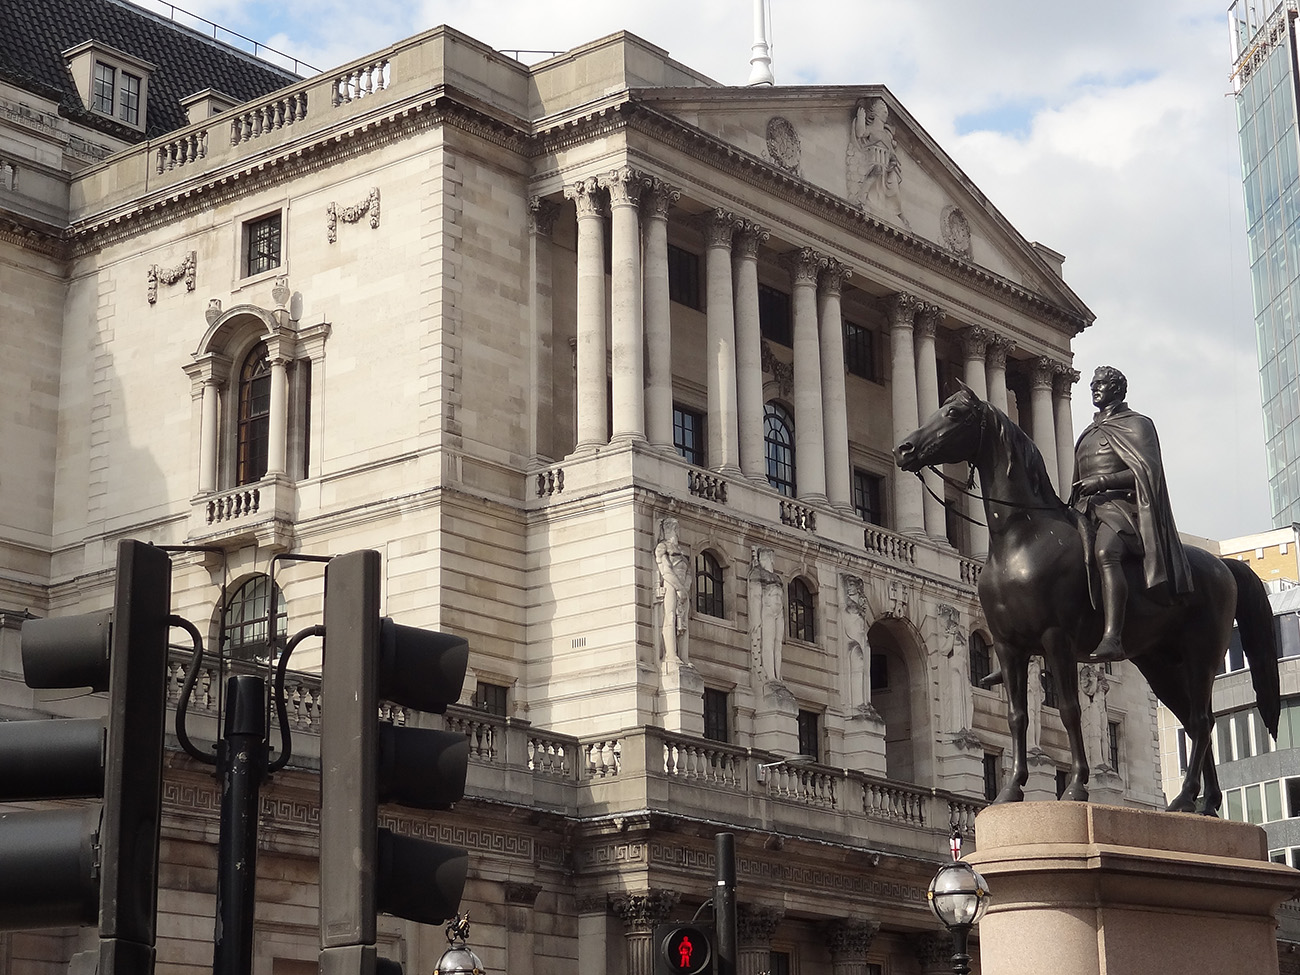
 On 8 February, the Bank of England issued a statement that was seen by many as a warning for earlier and speedier than previously anticipated increases in the UK base rate. Mark Carney, the governor of the Bank of England, referred in his statement to ‘recent forecasts’ which make it more likely that ‘monetary policy would need to be tightened somewhat earlier and by a somewhat greater extent over the forecast period than anticipated at the time of the November report’.
A similar picture emerges on the other side of the Atlantic. With labour markets continuing to deliver spectacularly high rates of employment (the highest in the last 17 years), there are also now signs that wages are on an upward trajectory. According to a recent report from the US Bureau of Labor Statistics, US wage growth has been stronger than expected, with average hourly earnings rising by 2.9 percent – the strongest growth since 2009.
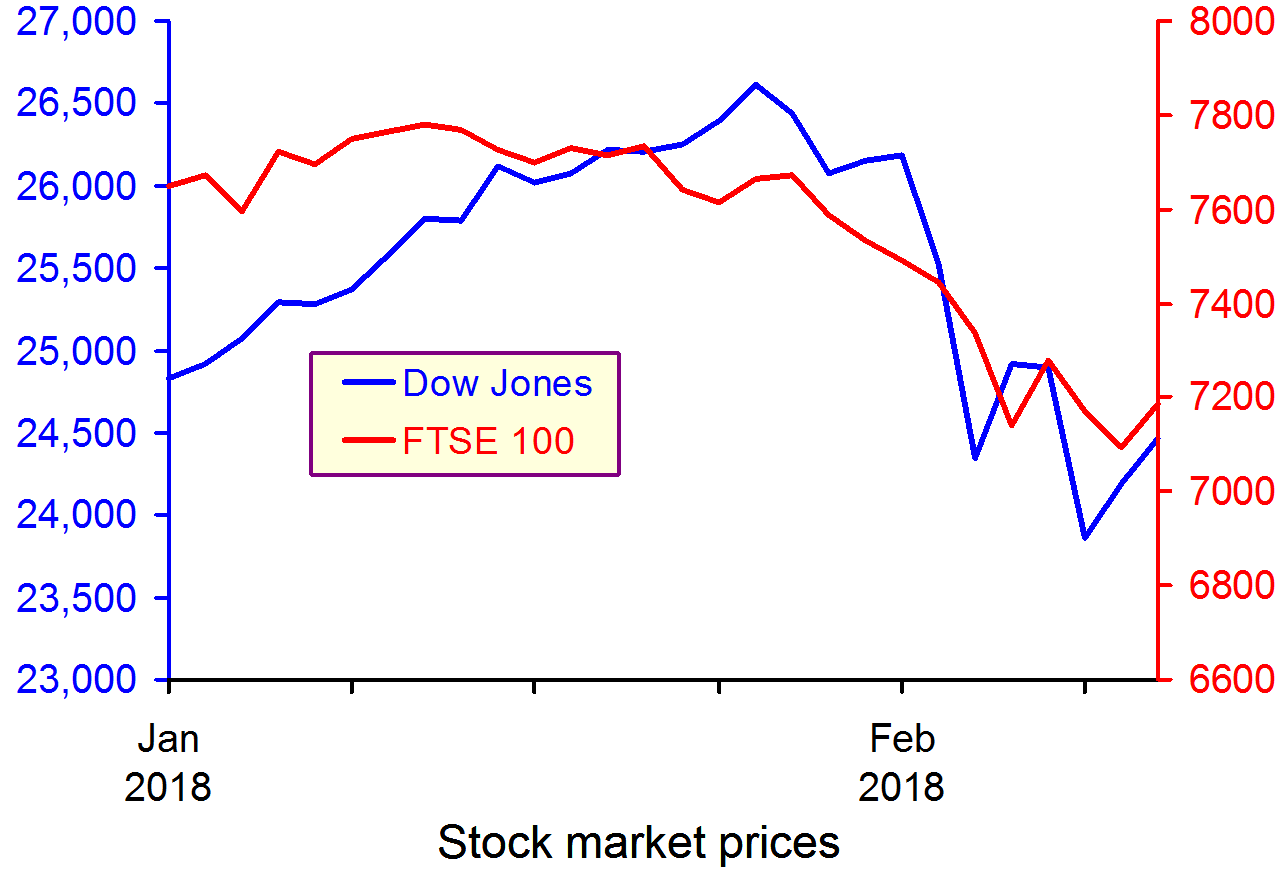
 These statements have coincided with a week of sharp corrections and turbulence in the world’s largest capital markets, as investors become increasingly conscious of the threat of rising inflation – and the possibility of tighter monetary policy.
The Dow Jones plunged from an all-time high of 26,186 points on 1 February to 23,860 a week later – losing more than 10 per cent of its value in just five trading sessions (suffering a 4.62 percentag fall on 5 February alone – the worst one-day point fall since 2011). European and Asian markets followed suit, with the FTSE-100, DAX and NIKKEI all suffering heavy losses in excess of 5 per cent over the same period.
 But why should higher inflationary expectations fuel a sell-off in global capital markets? After all, what firm wouldn’t like to sell its commodities at a higher price? Well, that’s not entirely true. Investors know that further increases in inflation are likely to be met by central banks hiking interest rates. This is because central banks are unlikely to be willing or able to allow inflation rates to rise much above their target levels.
The Bank of England, for instance, sets itself an inflation target of 2%. The actual ongoing rate of inflation reported in the latest quarterly Inflation Report is 3% (50 per cent higher than the target rate).
Any increase in interest rates is likely to have a direct impact on both the demand and the supply side of the economy.
Consumers (the demand side) would see their cost of borrowing increase. This could put pressure on households that have accumulated large amounts of debt since the beginning of the recession and could result in lower consumer spending.
Firms (the supply side) are just as likely to suffer higher borrowing costs, but also higher operational costs due to rising wages – both of which could put pressure on profit margins.
It now seems more likely that we are coming towards the end of the post-2008 era – a period that saw the cost of money being driven down to unprecedentedly low rates as the world’s largest economies dealt with the aftermath of the Great Recession.
For some, this is not all bad news – as it takes us a step closer towards a more historically ‘normal’ equilibrium. It remains to be seen how smooth such a transition will be and to what extent the high-leveraged world economy will manage to keep its current pace, despite the increasingly hawkish stance in monetary policy by the world’s biggest central banks.
Video
Dow plunges 1,175 – worst point decline in history CNN Money, Matt Egan (5/2/18)
Articles
Global Markets Shed $5.2 Trillion During the Dow’s Stock Market Correction Fortune, Lucinda Shen (9/2/18)
Bank of England warns of larger rises in interest rates Financial Times, Chris Giles and Gemma Tetlow (8/2/18)
Stocks are now in a correction — here’s what that means Business Insider, Andy Kiersz (8/2/18)
US economy adds 200,000 jobs in January and wages rise at fastest pace since recession Business Insider, Akin Oyedele (2/2/18)
Questions
- Using supply and demand diagrams, explain the likely effect of an increase in interest rates to equilibrium prices and output. Is it good news for investors and how do you expect them to react to such hikes? What other factors are likely to influence the direction of the effect?
- Do you believe that the current ultra-low interest rates could stay with us for much longer? Explain your reasoning.
- What is likely to happen to the exchange rate of the pound against the US dollar, if the Bank of England increases interest rates first?
- Why do stock markets often ‘overshoot’ in responding to expected changes in interest rates or other economic variables
 On 2 November, the Bank of England raised Bank rate from 0.25% to 0.5% – the first rise since July 2007. But was now the right time to raise interest rates? Seven of the nine-person Monetary Policy Committee voted to do so; two voted to keep Bank Rate at 0.25%.
Raising the rate, on first sight, may seem a surprising decision as growth remains sluggish. Indeed, the two MPC members who voted against the rise argued that wage growth was too weak to justify the rise. Also, inflation is likely to fall as the effects of the Brexit-vote-induced depreciation of sterling on prices feeds through the economy. In other words, prices are likely to settle at the new higher levels but will not carry on rising – at least not at the same rate.
So why did the other seven members vote to raise Bank Rate. There are three main arguments:
|
|
| • |
Inflation, at 3%, is above the target of 2% and is likely to stay above the target if interest rates are not raised. |
| • |
There is little spare capacity in the economy, with low unemployment. There is no shortage of aggregate demand relative to output. |
| • |
With productivity growth being negligible and persistently below that before the financial crisis, aggregate demand, although growing slower than in the past, is growing excessively relative to the growth in aggregate supply. |
As the Governor stated at the press conference:
In many respects, the decision today is straightforward: with inflation high, slack disappearing, and the economy growing at rates above its speed limit, inflation is unlikely to return to the 2% target without some increase in interest rates.
But, of course, the MPC’s forecasts may turn out to be incorrect. Many things are hard to predict. These include: the outcomes of the Brexit negotiations; consumer and business confidence and their effects on consumption and investment; levels of growth in other countries and their effects on UK exports; and the effects of the higher interest rates on saving and borrowing and hence on aggregate demand.
 The Bank of England is well aware of these uncertainties. Although it plans two more rises in the coming months and then Bank Rate remaining at 1% for some time, this is based on its current assessment of the outlook for the economy. If circumstances change, the Bank will adjust the timing and total amount of future interest rate changes.
There are, however, dangers in the rise in interest rates. Household debt is at very high levels and, although the cost of servicing these debts is relatively low, even a rise in interest rates of just 0.25 percentage points can represent a large percentage increase. For example, a rise in a typical variable mortgage interest rate from 4.25% to 4.5% represents a 5.9% increase. Any resulting decline in consumer spending could dent business confidence and reduce investment.
Nevertheless, the Bank estimates that the effect of higher mortgage rates is likely to be small, given that some 60% of mortgages are at fixed rates. However, people need to refinance such rates every two or three years and may also worry about the rises to come promised by the Bank.
Articles
Bank of England deputy says interest rate rise means pain for households and more hikes could be in store Independent, Ben Chapman (3/11/17)
UK interest rates: Bank of England shrugs off Brexit nerves to launch first hike in over a decade Independent, Ben Chu (2/11/17)
Bank of England takes slow lane after first rate hike since Reuters, David Milliken, William Schomberg and Julian Satterthwaite (2/11/17)
First UK rate rise in a decade will be a slow burn Financial Times, Gemma Tetlow (2/11/17)
The Bank of England’s Rate Rise Could Spook Britain’s Economy Bloomberg, Fergal O’Brien and Brian Swint (3/11/17)
Bank of England hikes rates for the first time in a decade CNBC, Sam Meredith (2/11/17)
Interest rates rise in Britain for the first time in a decade The Economist (2/11/17)
Bank of England publications
Bank of England Inflation Report Press Conference, Opening Remarks Financial Times on YouTube, Mark Carney (2/11/17)
Bank of England Inflation Report Press Conference, Opening Remarks Bank of England, Mark Carney (2/11/17)
Inflation Report Press Conference (full) Bank of England on YouTube (2/11/17)
Inflation Report Bank of England (November 2017)
Monetary Policy Summary and minutes of the Monetary Policy Committee meeting ending on 1 November 2017 Bank of England (2/11/17)
Questions
- Why did the majority of MPC members feel that now was the right time to raise interest rates whereas a month ago was the wrong time?
- Why did the exchange rate fall when the announcement was made?
- How does a monetary policy of targeting the rate of inflation affect the balance between aggregate demand and aggregate supply?
- Can monetary policy affect potential output, or only actual output?
- If recent forecasts have downgraded productivity growth and hence long-term economic growth, does this support the argument for raising interest rates or does it suggest that monetary policy should be more expansionary?
- Why does the MPC effectively target inflation in the future (typically in 24 months’ time) rather than inflation today? Note that Mark Carney at the press conference said, “… it isn’t so much where inflation is now, but where it’s going that concerns us.”
- To what extent can the Bank of England’s monetary policy be described as ‘discretionary’?