Growth in the eurozone has slowed. The European Central Bank (ECB) now expects it to be 1.1% this year; in December, it had forecast a rate of 1.7% for 2019. Mario Draghi, president of the ECB, in his press conference, said that ‘the weakening in economic data points to a sizeable moderation in the pace of the economic expansion that will extend into the current year’. Faced with a slowing eurozone economy, the ECB has announced further measures to stimulate economic growth.
First it has indicated that interest rates will not rise until next year at the earliest ‘and in any case for as long as necessary to ensure the continued sustained convergence of inflation to levels that are below, but close to, 2% over the medium term’. The ECB currently expects HIPC inflation to be 1.2% in 2019. It was expected to raise interest rates later this year – probably by the end of the summer. The ECB’s main refinancing interest rate, at which it provides liquidity to banks, has been zero since March 2016, and so there was no scope for lowering it.
Second, although quantitative easing (the asset purchase programme) is coming to an end, there will be no ‘quantitative tightening’. Instead, the ECB will purchase additional assets to replace any assets that mature, thereby leaving the stock of assets held the same. This would continue ‘for an extended period of time past the date when we start raising the key ECB interest rates, and in any case for as long as necessary to maintain favourable liquidity conditions and an ample degree of monetary accommodation’.
Third, the ECB is launching a new series of ‘quarterly targeted longer-term refinancing operations (TLTRO-III), starting in September 2019 and ending in March 2021, each with a maturity of two years’. These are low-interest loans to banks in the eurozone for use for specific lending to businesses and households (other than for mortgages) at below-market rates. Banks will be able to borrow up to 30% of their eligible assets (yet to be fully defined). These, as their acronym suggests, are the third round of such loans. The second round was relatively successful. As the Barron’s article linked below states:
Banks boosted their long-term borrowing from the ECB by 70% over the course of the program, although they did not manage to increase their holdings of business loans until after TLTRO II had finished disbursing funds in March 2017.
Whether these measures will be enough to raise growth rates in the eurozone depends on a range of external factors affecting aggregate demand. Draghi identified three factors which could have a negative effect.
Brexit. The forecasts assume an orderly Brexit in accordance with the withdrawal deal agreed between the European Commission and the UK government. With the House of Commons having rejected this deal twice, even though it has agreed that there should not be a ‘no-deal Brexit’, this might happen as it is the legal default position. This could have a negative effect on the eurozone economy (as well as a significant one on the UK economy). Even an extension of Article 50 could create uncertainty, which would also have a negative effect
Trade wars. If President Trump persists with his protectionist policy, this will have a negative effect on growth in the eurozone and elsewhere.
China. Chinese growth has slowed and this dampens global growth. What is more, China is a major trading partner of the eurozone countries and hence slowing Chinese growth impacts on the eurozone through the international trade multiplier. The ECB has taken this into account, but if Chinese growth slows more than anticipated, this will further push down eurozone growth.
Then there are internal uncertainties in the eurozone, such as the political and economic uncertainty in Italy, which in December 2018 entered a recession (2 quarters of negative economic growth). Its budget deficit is rising and this is creating conflict with the European Commission. Also, there are likely to be growing tensions within Italy as the government raises taxes.
Faced with these and other uncertainties, the measures announced by Mario Draghi may turn out not to be enough. Perhaps in a few months’ there may have to be a further round of quantitative easing.
Investigate the history of quantitative easing and its use by the Fed, the Bank of England and the ECB. What is the current position of the three central banks on ‘quantitative tightening’, whereby central banks sell some of the stock of assets they have purchased during the process of quantitative easing or not replace them when they mature?
What are TLTROs and what use of them has been made by the ECB? Do they involve the creation of new money?
What will determine the success of the proposed TLTRO III scheme?
If the remit of central banks is to keep inflation on target, which in the ECB’s case means below 2% HIPC inflation but close to it over the medium term, why do people talk about central banks using monetary policy to revive a flagging economy?
What is ‘forward guidance’ by central banks and what determines its affect on aggregate demand?
It is impossible to make both precise and accurate forecasts of a country’s rate of economic growth, even a year ahead. And the same goes for other macroeconomic variables, such as the rate of unemployment or the balance of trade. The reason is that there are so many determinants of these variables, such as political decisions or events, which themselves are unpredictable. Economics examines the effects of human interactions – it is a social science, not a natural science. And human behaviour is hard to forecast.
Leading indicators
Nevertheless, economists do make forecasts. These are best estimates, taking into account a number of determinants that can be currently measured, such as tax or interest rate changes. These determinants, or ‘leading indicators’, have been found to be related to future outcomes. For example, surveys of consumer and business confidence give a good indication of future consumer expenditure and investment – key components of GDP.
Leading indicators do not have to be directly causal. They could, instead, be a symptom of underlying changes that are themselves likely to affect the economy in the future. For example, changes in stock market prices may reflect changes in confidence or changes in liquidity. It is these changes that are likely to have a direct or indirect causal effect on future output, employment, prices, etc.
Macroeconomic models show the relationships between variables. They show how changes in one variable (e.g. increased investment) affect other variables (e.g. real GDP or productivity). So when an indicator changes, such as a rise in interest rates, economists use these models to estimate the likely effect, assuming other things remain constant (ceteris paribus). The problem is that other things don’t remain constant. The economy is buffeted around by a huge range of events that can affect the outcome of the change in the indicator or the variable(s) it reflects.
Forecasting can never therefore be 100% accurate (except by chance). Nevertheless, by carefully studying leading indicators, economists can get a good idea of the likely course of the economy.
Leading indicators of the US economy
At the start of 2019, several leading indicators are suggesting the US economy is likely to slow and might even go into recession. The following are some of the main examples.
Political events. This is the most obvious leading indicator. If decisions are made that are likely to have an adverse effect on growth, a recession may follow. For example, decisions in the UK Parliament over Brexit will directly impact on UK growth.
As far as the USA is concerned, President Trump’s decision to put tariffs on steel and aluminium imports from a range of countries, including China, the EU and Canada, led these countries to retaliate with tariffs on US imports. A tariff war has a negative effect on growth. It is a negative sum game. Of course, there may be a settlement, with countries agreeing to reduce or eliminate these new tariffs, but the danger is that the trade war may continue long enough to do serious damage to global economic growth.
But just how damaging it is likely to be is impossible to predict. That depends on future political decisions, not just those of the recent past. Will there be a global rise in protectionism or will countries pull back from such a destructive scenario? On 29 December, President Trump tweeted, ‘Just had a long and very good call with President Xi of China. Deal is moving along very well. If made, it will be very comprehensive, covering all subjects, areas and points of dispute. Big progress being made!’ China said that it was willing to work with the USA over reaching a consensus on trade.
Rises in interest rates. If these are in response to a situation of excess demand, they can be seen as a means of bringing inflation down to the target level or of closing a positive output gap, where real national income is above its potential level. They would not signify an impending recession. But many commentators have interpreted rises in interest rates in the USA as being different from this.
The Fed is keen to raise interest rates above the historic low rates that were seen as an ’emergency’ response to the financial crisis of 2007–8. It is also keen to reverse the policy of quantitative easing and has begun what might be described as ‘quantitative tightening’: not buying new bonds when existing ones that it purchased during rounds of QE mature. It refers to this interest rate and money supply policy as ‘policy normalization‘. The Fed maintains that such policy is ‘consistent with sustained expansion of economic activity, strong labor market conditions, and inflation near the Committee’s symmetric 2 percent objective over the medium term’.
However, many commentators, including President Trump, have accused the Fed of going too fast in this process and of excessively dampening the economy. It has already raised the Federal Funds Rate nine times by 0.25 percentage points each time since December 2015 (click here for a PowerPoint file of the chart). What is more, announcing that the policy will continue makes such announcements themselves a leading indicator of future rises in interest rates, which are a leading indicator of subsequent effects on aggregate demand. The Fed has stated that it expects to make two more 0.25 percentage point rises during 2019.
Surveys of consumer and business confidence. These are some of the most significant leading indicators as consumer confidence affects consumer spending and business confidence affects investment. According to the Duke CFO Global Business Outlook, an influential survey of Chief Financial Officers, ‘Nearly half (48.6 per cent) of US CFOs believe that the US will be in recession by the end of 2019, and 82 per cent believe that a recession will have begun by the end of 2020’. Such surveys can become self-fulfilling, as a reported decline in confidence can itself undermine confidence as both firms and consumers ‘catch’ the mood of pessimism.
Stock market volatility. When stock markets exhibit large falls and rises, this is often a symptom of uncertainty; and uncertainty can undermine investment. Stock market volatility can thus be a leading indicator of an impending recession. One indicator of such volatility is the VIX index. This is a measure of ’30-day expected volatility of the US stock market, derived from real-time, mid-quote prices of S&P 500® Index (SPXSM) call and put options. On a global basis, it is one of the most recognized measures of volatility – widely reported by financial media and closely followed by a variety of market participants as a daily market indicator.’ The higher the index, the greater the volatility. Since 2004, it has averaged 18.4; from 17 to 28 December 2018, it averaged 28.8. From 13 to 24 December, the DOW Jones Industrial Average share index fell by 11.4 per cent, only to rise by 6.2 per cent by 27 December. On 26 December, the S&P 500 index rallied 5 per cent, its best gain since March 2009.
Not all cases of market volatility, however, signify an impending recession, but high levels of volatility are one more sign of investor nervousness.
Oil prices. When oil prices fall, this can be explained by changes on the demand and/or supply side of the oil market. Oil prices have fallen significantly over the past two months. Until October 2018, oil prices had been rising, with Brent Crude reaching $86 per barrel by early October. By the end of the year the price had fallen to just over $50 per barrel – a fall of 41 per cent. (Click here for a PowerPoint file of the chart.) Part of the explanation is a rise in supply, with shale oil production increasing and also increased output from Russia and Saudi Arabia, despite a commitment by the two countries to reduce supply. But the main reason is a fall in demand. This reflects both a fall in current demand and in anticipated future demand, with fears of oversupply causing oil companies to run down stocks.
Falling oil prices resulting from falling demand are thus an indicator of lack of confidence in the growth of future demand – a leading indicator of a slowing economy.
The yield curve. This depicts the yields on government debt with different lengths to maturity at a given point in time. Generally, the curve slopes upwards, showing higher rates of return on bonds with longer to maturity. This is illustrated by the blue line in the chart. (Click here for a PowerPoint file of the chart.) This is as you would expect, with people requiring a higher rate of return on long-term lending, where there is normally greater uncertainty. But, as the Bloomberg article, ‘Don’t take your eyes off the yield curve‘ states:
Occasionally, the curve flips, with yields on short-term debt exceeding those on longer bonds. That’s normally a sign investors believe economic growth will slow and interest rates will eventually fall. Research by the Federal Reserve Bank of San Francisco has shown that an inversion has preceded every US recession for the past 60 years.
The US economy is 37 quarters into what may prove to be its longest expansion on record. Analysts surveyed by Bloomberg expect gross domestic product growth to come in at 2.9 percent this year, up from 2.2 percent last year. Wages are rising as unfilled vacancies hover near all-time highs.
With times this good, the biggest betting game on Wall Street is when they’ll go bad. Barclays Plc, Goldman Sachs Group Inc., and other banks are predicting inversion will happen sometime in 2019. The conventional wisdom: Afterward it’s only a matter of time – anywhere from 6 to 24 months – before a recession starts.
As you can see from the chart, the yield curve on 24 December 2018 was still slightly upward sloping (expect between 6-month and 1-year bonds) – but possibly ready to ‘flip’.
However, despite the power of an ‘inverted’ yield in predicting previous recessions, it may be less reliable now. The Fed, as we saw above, has already signalled that it expects to increase short-term rates in 2019, probably at least twice. That alone could make the yield curve flatter or even downward sloping. Nevertheless, it is still generally thought that a downward sloping yield curve would signal belief in a likely slowdown, if not outright recession.
So, is the USA heading for recession?
The trouble with indicators is that they suggest what is likely – not what will definitely happen. Governments and central banks are powerful agents. If they believed that a recession was likely, then fiscal and monetary policy could be adjusted. For example, the Fed could halt its interest rate rises and quantitative tightening, or even reverse them. Also, worries about protectionism may subside if the USA strikes new trade deals with various countries, as it did with Canada and Mexico in USMCA.
Are periods of above-trend expansion necessarily followed by a recession?
Give some examples of leading indicators other than those given above and discuss their likely reliability in predicting a recession.
Find out what has been happening to confidence levels in the EU over the past 12 months. Does this provide evidence of an impending recession in the EU?
For what reasons may there be lags between a change in an indicator and a change in the variables for which it is an indicator?
Why has the shape of the yield curve previously been a good predictor of the future course of the economy? Is it likely to be at present?
What is the relationship between interest rates, government bond prices (‘Treasuries’ in the USA) and the yield on such bonds?
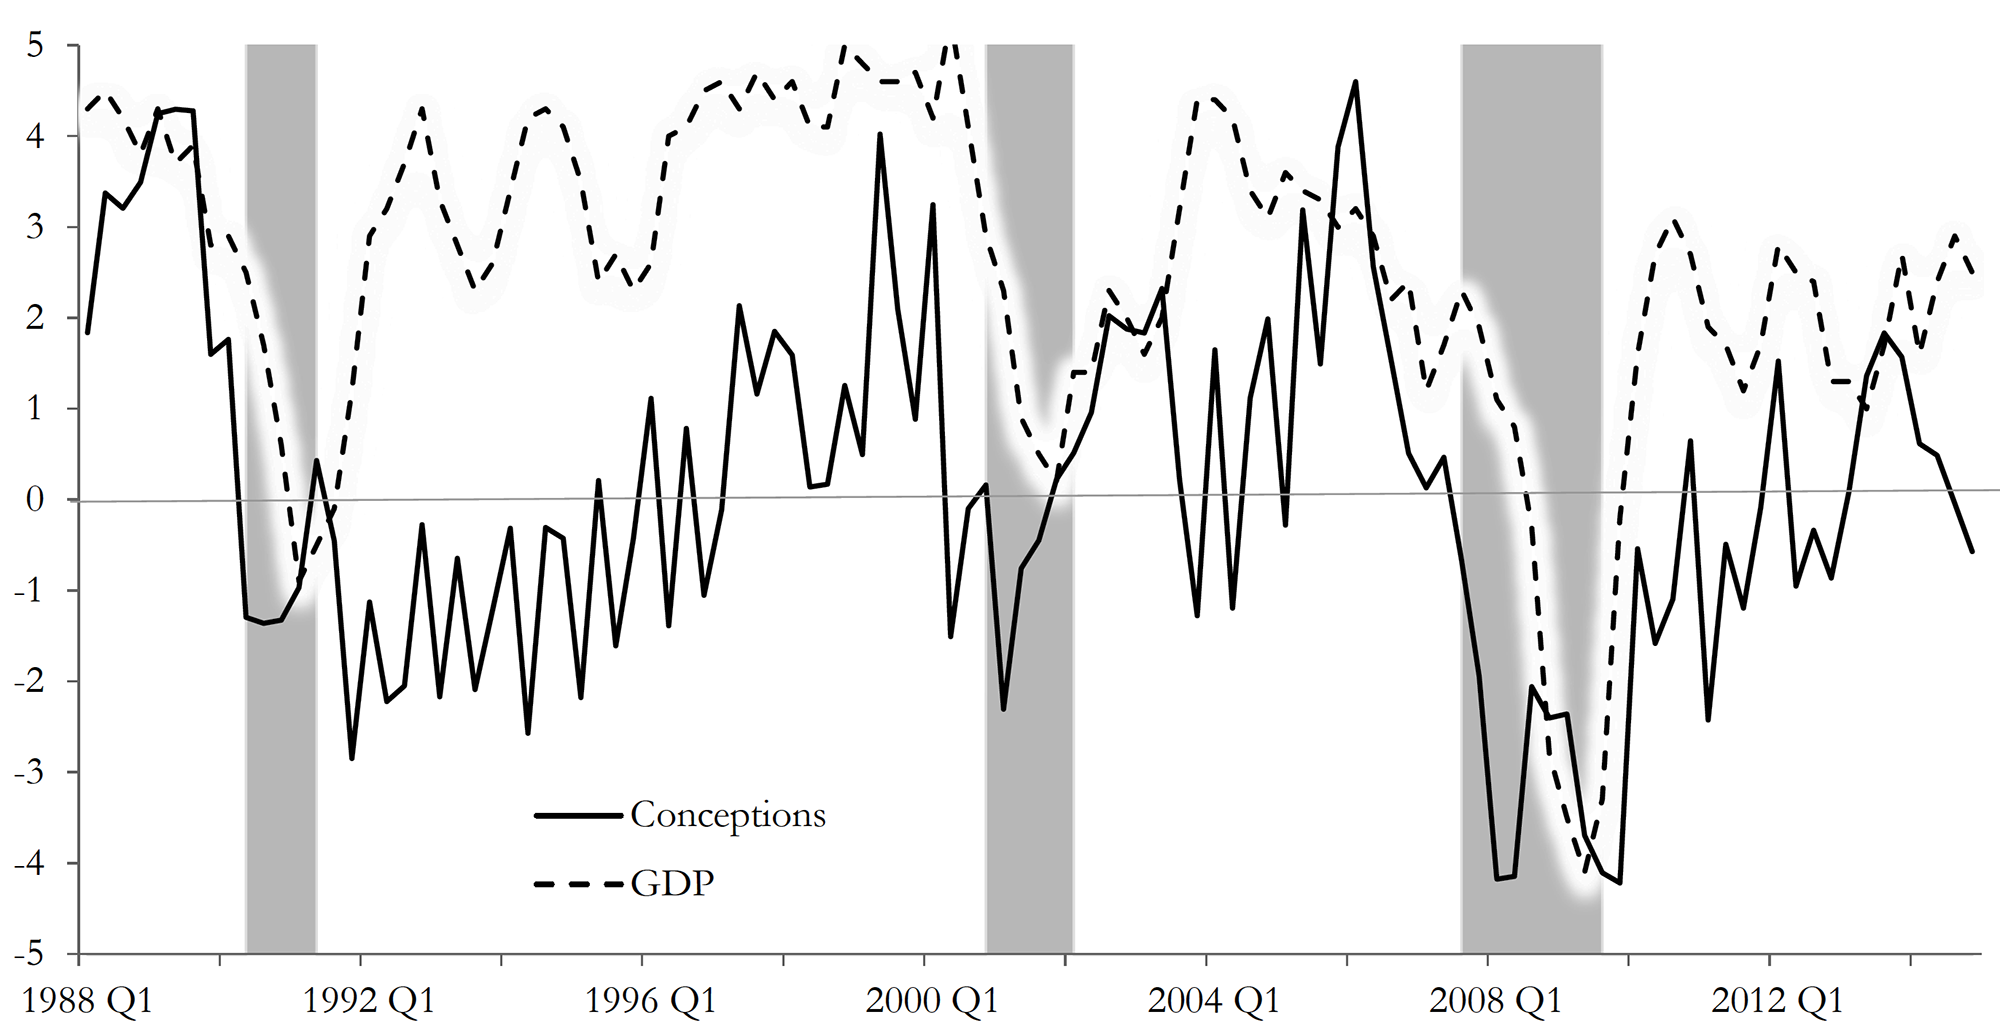
Would you start a family if you were pessimistic about the future of the economy? Buckles et al (2017) (see link below) believe that fewer of us would do so and, therefore, fertility rates could be used by investors and central banks as an early signal to pick up subtle changes in consumer confidence and overall economic climate.
Their study titled ‘Fertility is a leading economic indicator’ uses ‘live births’ data, sourced from US birth certificates, to explore if there is any association between fertility changes (measured as the rate of change in number of births) and GDP growth. Their results suggest that, in the case of the USA, there is: dips in fertility rates tend to precede by several quarters slowdown in economic activity. As the authors state:
The growth rate of conceptions declines prior to economic downturns and the decline occurs several quarters before recessions begin. Our measure of conceptions is constructed using live births; we present evidence suggesting that our results are indeed driven by changes in conceptions and not by changes in abortion or miscarriage. Conceptions compare well with or even outperform other economic indicators in anticipating recessions.
Conception and GDP Growth Rates (source Buckles et al p33: see below)
Although this is not the first piece of academic writing to claim that fertility has pro-cyclical qualities (see for instance, Adsera (2004, 2011), Adsera and Menendez (2011), Currie and Schwandt (2014) and Chatterjee and Vogle (2016) linked below), it is, to the best of our knowledge, the most recent paper (in terms of data used) to depict this relationship and to explore the suitability of fertility as a macroeconomic indicator to predict recessions.
Economies, after all, are groups of people who participate actively in day-to-day production and consumption activities – as consumers, workers and business leaders. Changes in their environment should affect their expectations about the future.
Are people, however, forward-looking enough to guide their current behaviours by their expectations of future economic outcomes? They may be, according to the findings of this study.
Did you know, for instance, that sales of ties tend to increase in economic downturns, as men buy more ties to show that they are working harder, in fear of losing their job[1]? But this is probably a topic for another blog.
Give two reasons why fertility rates may be a good indicator of economic activity.
Give two reasons why fertility rates may NOT be a good indicator of economic activity.
Do a literature search to identify and explain an ‘unorthodox’ macroeconomic indicator of your choice, and how it has been used to track economic activity.
Senior Bank of England officials appeared before the House of Commons’ Treasury Select Committee on 21 February to report on the state of the economy and the future path for inflation and interest rates. One topic considered was the role of depreciation.
The pound has depreciated since the referendum on EU membership in June 2016. The exchange rate index today is some 9% below that before the referendum and 15% below the peak a year before the referendum.
It had fallen as much as 14% by October 2016 below the level before the referendum and 20% below its peak, pushed down partly by the cut in Bank Rate from 0.5% to 0.25% following the referendum. In November 2017, the Bank’s Monetary Policy Committee raised Bank Rate back to 0.5%. Two or three more rises of 25 basis points are expected over the next couple of years. This has helped to strengthen sterling somewhat. (Click here for a PowerPoint of the chart below.)
But has the depreciation been advantageous or disadvantageous to the economy? Here the Governor (Mark Carney) and the Chief Economist (Andy Haldane) appeared to differ. Andy Haldane said:
A combination of the weaker pound and a stronger global economy has worked its magic. That has meant that net trade has been a significant contributor, and we expect those effects to continue over the next two or three years. … Depreciations work, and that’s how they work.
By contrast, Mark Carney said:
Depreciations don’t work. They have an economic effect, but they’re not a good economic strategy. They may be an outcome of various things … but it’s how you make yourself poorer.
Are these statements contradictory or are they simply emphasising different effects of depreciation?
Both Andy Haldane and Mark Carney would accept that a depreciation makes imports more expensive and thus reduces real incomes (at least in the short run). They would also accept that a depreciation makes exports priced in pounds cheaper in foreign currency terms and thus can boost the demand for exports.
There is disagreement over two things, however. The first is the effect on people’s real incomes in the long run. Will any fall in real incomes from higher-priced imports in the short run be offset in the long run by higher economic growth?
This relates to a second area of disagreement. This is whether a depreciation can act as a significant driver for exports over the longer term. The increased incentive on the demand side (from consumers abroad to buy UK exports) could be offset by a disincentive for exporters to become more efficient and/or to compete in terms of quality. In other words, although it can give exporters a price advantage, the crucial question is the extent to which they take advantage of this, or merely take higher profits.
The disagreements thus relate primarily to the incentive effects over the longer term.
How does a depreciation affect the demand for and supply of imports and exports?
What determines the size of the effect on inflation of a depreciation?
What is the significance of the price elasticity of demand for and supply of sterling in determining the size of depreciation resulting from a change in confidence or a change in interest rates?
How does productivity growth impact on the effectiveness of a depreciation in leading to higher economic growth?
In what ways might a depreciation affect productivity growth?
On 8 February, the Bank of England issued a statement that was seen by many as a warning for earlier and speedier than previously anticipated increases in the UK base rate. Mark Carney, the governor of the Bank of England, referred in his statement to ‘recent forecasts’ which make it more likely that ‘monetary policy would need to be tightened somewhat earlier and by a somewhat greater extent over the forecast period than anticipated at the time of the November report’.
A similar picture emerges on the other side of the Atlantic. With labour markets continuing to deliver spectacularly high rates of employment (the highest in the last 17 years), there are also now signs that wages are on an upward trajectory. According to a recent report from the US Bureau of Labor Statistics, US wage growth has been stronger than expected, with average hourly earnings rising by 2.9 percent – the strongest growth since 2009.
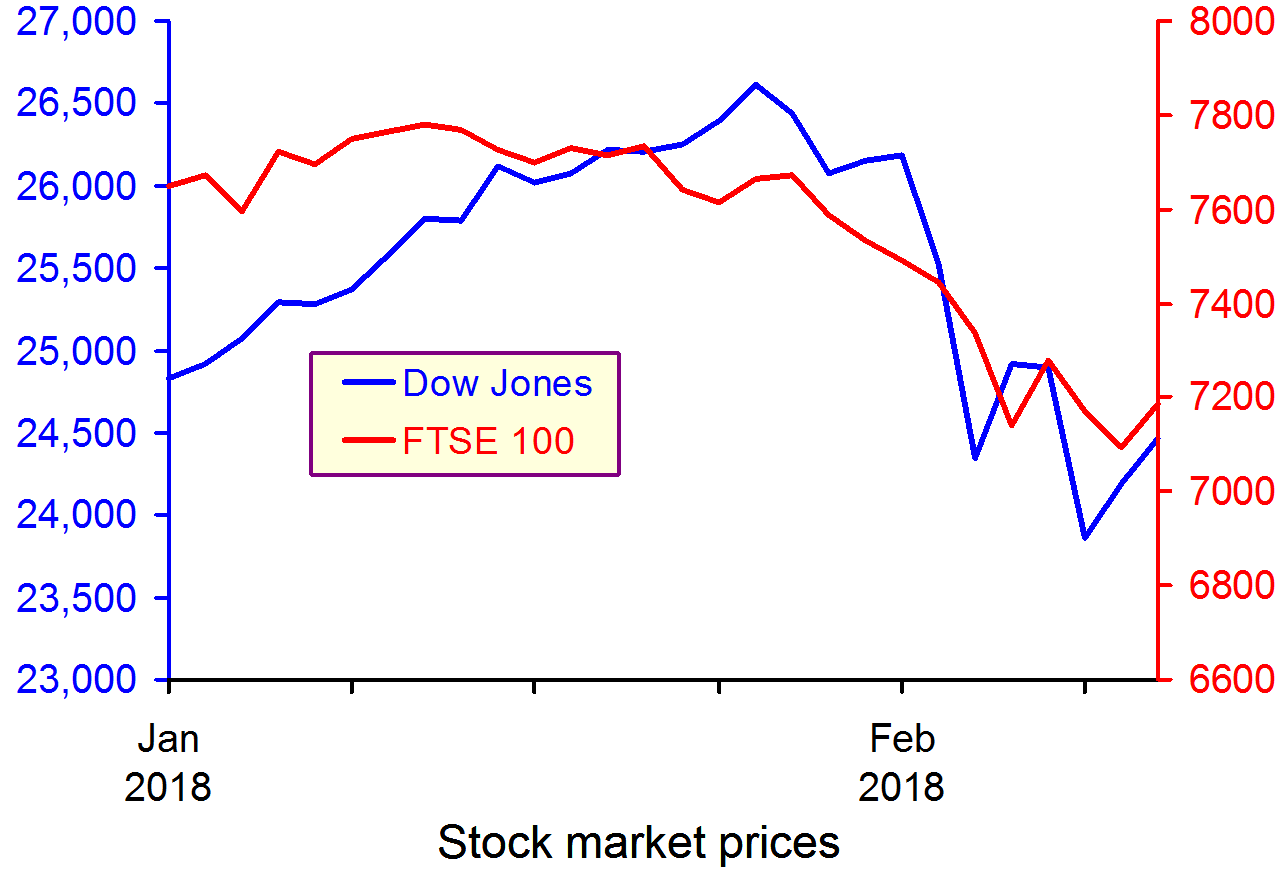
These statements have coincided with a week of sharp corrections and turbulence in the world’s largest capital markets, as investors become increasingly conscious of the threat of rising inflation – and the possibility of tighter monetary policy.
The Dow Jones plunged from an all-time high of 26,186 points on 1 February to 23,860 a week later – losing more than 10 per cent of its value in just five trading sessions (suffering a 4.62 percentag fall on 5 February alone – the worst one-day point fall since 2011). European and Asian markets followed suit, with the FTSE-100, DAX and NIKKEI all suffering heavy losses in excess of 5 per cent over the same period.
But why should higher inflationary expectations fuel a sell-off in global capital markets? After all, what firm wouldn’t like to sell its commodities at a higher price? Well, that’s not entirely true. Investors know that further increases in inflation are likely to be met by central banks hiking interest rates. This is because central banks are unlikely to be willing or able to allow inflation rates to rise much above their target levels.
The Bank of England, for instance, sets itself an inflation target of 2%. The actual ongoing rate of inflation reported in the latest quarterly Inflation Report is 3% (50 per cent higher than the target rate).
Any increase in interest rates is likely to have a direct impact on both the demand and the supply side of the economy.
Consumers (the demand side) would see their cost of borrowing increase. This could put pressure on households that have accumulated large amounts of debt since the beginning of the recession and could result in lower consumer spending.
Firms (the supply side) are just as likely to suffer higher borrowing costs, but also higher operational costs due to rising wages – both of which could put pressure on profit margins.
It now seems more likely that we are coming towards the end of the post-2008 era – a period that saw the cost of money being driven down to unprecedentedly low rates as the world’s largest economies dealt with the aftermath of the Great Recession.
For some, this is not all bad news – as it takes us a step closer towards a more historically ‘normal’ equilibrium. It remains to be seen how smooth such a transition will be and to what extent the high-leveraged world economy will manage to keep its current pace, despite the increasingly hawkish stance in monetary policy by the world’s biggest central banks.
Using supply and demand diagrams, explain the likely effect of an increase in interest rates to equilibrium prices and output. Is it good news for investors and how do you expect them to react to such hikes? What other factors are likely to influence the direction of the effect?
Do you believe that the current ultra-low interest rates could stay with us for much longer? Explain your reasoning.
What is likely to happen to the exchange rate of the pound against the US dollar, if the Bank of England increases interest rates first?
Why do stock markets often ‘overshoot’ in responding to expected changes in interest rates or other economic variables
 Growth in the eurozone has slowed. The European Central Bank (ECB) now expects it to be 1.1% this year; in December, it had forecast a rate of 1.7% for 2019. Mario Draghi, president of the ECB, in his press conference, said that ‘the weakening in economic data points to a sizeable moderation in the pace of the economic expansion that will extend into the current year’. Faced with a slowing eurozone economy, the ECB has announced further measures to stimulate economic growth.
 Second, although quantitative easing (the asset purchase programme) is coming to an end, there will be no ‘quantitative tightening’. Instead, the ECB will purchase additional assets to replace any assets that mature, thereby leaving the stock of assets held the same. This would continue ‘for an extended period of time past the date when we start raising the key ECB interest rates, and in any case for as long as necessary to maintain favourable liquidity conditions and an ample degree of monetary accommodation’.
 ECB launches new series of targeted longer-term refinancing operations
  It is impossible to make both precise and accurate forecasts of a country’s rate of economic growth, even a year ahead. And the same goes for other macroeconomic variables, such as the rate of unemployment or the balance of trade. The reason is that there are so many determinants of these variables, such as political decisions or events, which themselves are unpredictable. Economics examines the effects of human interactions – it is a social science, not a natural science. And human behaviour is hard to forecast.
 As far as the USA is concerned, President Trump’s
  However, many commentators, including President Trump, have accused the Fed of going too fast in this process and of excessively dampening the economy. It has already raised the Federal Funds Rate nine times by 0.25 percentage points each time since December 2015 (click
  Surveys of consumer and business confidence. These are some of the most significant leading indicators as consumer confidence affects consumer spending and business confidence affects investment. According to the
  Oil prices. When oil prices fall, this can be explained by changes on the demand and/or supply side of the oil market. Oil prices have fallen significantly over the past two months. Until October 2018, oil prices had been rising, with Brent Crude reaching $86 per barrel by early October. By the end of the year the price had fallen to just over $50 per barrel – a fall of 41 per cent. (Click
  The yield curve. This depicts the yields on government debt with different lengths to maturity at a given point in time. Generally, the curve slopes upwards, showing higher rates of return on bonds with longer to maturity. This is illustrated by the blue line in the chart. (Click