This blog discusses economic issues in the news and relates these news items to key economic concepts and theories. Links are given to a range of articles and other relevant material and each blog post finishes with a set of discussion questions.
The IMF has just published its six-monthly World Economic Outlook. This provides an assessment of trends in the global economy and gives forecasts for a range of macroeconomic indicators by country, by groups of countries and for the whole world.
This latest report is upbeat for the short term. Global economic growth is expected to be around 3.9% this year and next. This represents 2.3% this year and 2.5% next for advanced countries and 4.8% this year and 4.9% next for emerging and developing countries. For large advanced countries such rates are above potential economic growth rates of around 1.6% and thus represent a rise in the positive output gap or fall in the negative one.
But while the near future for economic growth seems positive, the IMF is less optimistic beyond that for advanced countries, where growth rates are forecast to decline to 2.2% in 2019, 1.7% in 2020 and 1.5% by 2023. Emerging and developing countries, however, are expected to see growth rates of around 5% being maintained.
For most countries, current favorable growth rates will not last. Policymakers should seize this opportunity to bolster growth, make it more durable, and equip their governments better to counter the next downturn.
By comparison with other countries, the UK’s growth prospects look poor. The IMF forecasts that its growth rate will slow from 1.8% in 2017 to 1.6% in 2018 and 1.5% in 2019, eventually rising to around 1.6% by 2023. The short-term figures are lower than in the USA, France and Germany and reflect ‘the anticipated higher barriers to trade and lower foreign direct investment following Brexit’.
The report sounds some alarm bells for the global economy.
The first is a possible growth in trade barriers as a trade war looms between the USA and China and as Russia faces growing trade sanctions. As Christine Lagarde, managing director of the IMF told an audience in Hong Kong:
Governments need to steer clear of protectionism in all its forms. …Remember: the multilateral trade system has transformed our world over the past generation. It helped reduce by half the proportion of the global population living in extreme poverty. It has reduced the cost of living, and has created millions of new jobs with higher wages. …But that system of rules and shared responsibility is now in danger of being torn apart. This would be an inexcusable, collective policy failure. So let us redouble our efforts to reduce trade barriers and resolve disagreements without using exceptional measures.
The second danger is a growth in world government and private debt levels, which at 225% of global GDP are now higher than before the financial crisis of 2007–9. With Trump’s policies of tax cuts and increased government expenditure, the resulting rise in US government debt levels could see some fiscal tightening ahead, which could act as a brake on the world economy. As Maurice Obstfeld , Economic Counsellor and Director of the Research Department, said at the Press Conference launching the latest World Economic Outlook:
Debts throughout the world are very high, and a lot of debts are denominated in dollars. And if dollar funding costs rise, this could be a strain on countries’ sovereign financial institutions.
In China, there has been a massive rise in corporate debt, which may become unsustainable if the Chinese economy slows. Other countries too have seen a surge in private-sector debt. If optimism is replaced by pessimism, there could be a ‘Minsky moment’, where people start to claw down on debt and banks become less generous in lending. This could lead to another crisis and a global recession. A trigger could be rising interest rates, with people finding it hard to service their debts and so cut down on spending.
The third danger is the slow growth in labour productivity combined with aging populations in developed countries. This acts as a brake on growth. The rise in AI and robotics (see the post Rage against the machine) could help to increase potential growth rates, but this could cost jobs in the short term and the benefits could be very unevenly distributed.
This brings us to a final issue and this is the long-term trend to greater inequality, especially in developed economies. Growth has been skewed to the top end of the income distribution. As the April 2017 WEO reported, “technological advances have contributed the most to the recent rise in inequality, but increased financial globalization – and foreign direct investment in particular – has also played a role.”
And the policy of quantitative easing has also tended to benefit the rich, as its main effect has been to push up asset prices, such as share and house prices. Although this has indirectly stimulated the economy, it has mainly benefited asset owners, many of whom have seen their wealth soar. People further down the income scale have seen little or no growth in their real incomes since the financial crisis.
For what reasons may the IMF forecasts turn out to be incorrect?
Why are emerging and developing countries likely to experience faster rates of economic growth than advanced countries?
What are meant by a ‘positive output gap’ and a ‘negative output gap’? What are the consequences of each for various macroeconomic indicators?
Explain what is meant by a ‘Minsky moment’. When are such moments likely to occur? Explain why or why not such a moment is likely to occur in the next two or three years?
For every debt owed, someone is owed that debt. So does it matter if global public and/or private debts rise? Explain.
What have been the positive and negative effects of the policy of quantitative easing?
What are the arguments for and against using tariffs and other forms of trade restrictions as a means of boosting a country’s domestic economy?
I recently found myself talking about my favourite TV shows from my childhood. Smurfs aside, the most popular one for me (and I suppose for many other people from my generation) had to be Knight Rider. It was a story about a crime fighter (David Hasselhoff) and his a heavily modified, artificially intelligent Pontiac Firebird. ‘Kitt’ was a car that could drive itself, engage in thoughtful and articulate conversations, carry out missions and (of course) come up with solutions to complex problems! A car that was very far from what was technologically possible in the 80s – and this was part of its charm.
Today this technology is becoming reality. Google, Tesla and most major automakers are testing self-driving cars with many advanced features like Kitt’s – if not better. They may not fire rockets, but they can drive themselves; they can search the internet; they can answer questions in a language of your choice; and they can be potentially integrated with a number of other technologies (such as car sharing apps) to revolutionise the way we own and use our cars. It will take years until we are able to purchase and use a self-driving car – but it appears very likely that this technology is going to become roadworthy within our lifetime.
Artificial intelligence (AI) is already becoming part of our life. You can buy a robotic vacuum cleaner online for less than a £1000. You can get gadgets like Amazon’s Alexa, that can help you automate your supermarket shopping, for instance. If you are Saudi, you can boast that you are compatriots with a humanoid: Saudi Arabia was the first country to grant citizenship to Sophia, an impressive humanoid and apparently a notorious conversationalist who does not miss an opportunity to address a large audience – and it has done so numerous times already in technology fairs, national congresses – even the UN Assembly! Sophia is the first robot to be honoured with a UN title!
What will be the impact of such technologies on labour markets? If cars can drive themselves, what is going to happen to the taxi drivers? Or the domestic housekeepers – who may find themselves increasingly displaced by cleaning robots. Or warehouse workers who may find themselves displaced by delivery bots (did you know that Alibaba, the Chinese equivalent of eBay, owns a warehouse where most of the work is carried out by robots?). There is no doubt that labour markets are bound to change. But should we (the human labour force) be worried about it? Acemoglu et al (2017) think that we should:
Using a model in which robots compete against human labor in the production of different tasks, we show that robots may reduce employment and wages […] According to our estimates, one more robot per thousand workers reduces the employment to population ratio by about 0.18–0.34 percentage points and wages by 0.25–0.5 per cent.[1]
Automation is likely to affect unskilled workers more than skilled ones, as unskilled jobs are the easiest ones to automate. This could have widespread social implications, as it might widen the divide between the poor (who are more likely to have unskilled jobs) and the affluent (who are more likely to own AI technologies). As mentioned in a recent Boston Consulting Group report (see below):
The future of work is likely to involve large structural changes to the labour market and potentially a net loss of jobs, mostly in routine occupations. An estimated 15 million UK jobs could be at risk of automation, with 63 per cent of all jobs impacted to a medium or large extent.
On the other hand, the adoption of automation is likely to result in higher efficiency, huge productivity gains and less waste. Automation will enable us to use the resources that we have in the most efficient way – and this is bound to result in wealth creation. It will also push human workers away from manual, routine jobs – and it will force them to acquire skills and engage in creative thinking. One thing is for certain: labour markets are changing and they are changing fast!
The Boston Consulting Group, Sutton Trust (July 2017)
Questions
What do you think is going to be the effect of automation on labour market participation in the future? Why?
Using the Solow growth model, explain how automation is likely to affect economic growth and capital returns.
In the context of the answer you gave to question 2, explain how human capital accumulation may affect the ability of workers to benefit from automation.
[1] Daron Acemoglu and Pascual Restrepo, Robots and Jobs: Evidence from US Labor Markets, NBER Working Paper No. 23285 (March 2017)
The last two weeks have been quite busy for macroeconomists, HM Treasury staff and statisticians in the UK. The Chancellor of the Exchequer, Mr Phillip Hammond, delivered his (fairly upbeat) Spring Budget Statement on 13 March, highlighting among other things the ‘stellar performance’ of UK labour markets. According to a Treasury Press Release:
Employment has increased by 3 million since 2010, which is the equivalent of 1,000 people finding work every day. The unemployment rate is close to a 40-year low. There is also a joint record number of women in work – 15.1 million. The OBR predict there will be over 500,000 more people in work by 2022.
To put these figures in perspective, according to recent ONS estimates, in January 2018 the rate of UK unemployment was 4.3 per cent – down from 4.4 per cent in December 2017. This is the lowest it has been since 1975. This is of course good news: a thriving labour market is a prerequisite for a healthy economy and a good sign that the UK is on track to full recovery from its 2008 woes.
The Bank of England welcomed the news with a mixture of optimism and relief, and signalled that the time for the next interest rate hike is nigh: most likely at the next MPC meeting in May.
But what is the practical implication of all this for UK consumers and workers?
For workers it means it’s a ‘sellers’ market’: as more people get into employment, it becomes increasingly difficult for certain sectors to fill new vacancies. This is pushing nominal wages up. Indeed, UK wages increased on average by 2.6 per cent year-to-year.
In real terms, however, wage growth has not been high enough to outpace inflation: real wages have fallen by 0.2 per cent compared to last year. Britain has received a pay rise, but not high enough to compensate for rising prices. To quote Matt Hughes, a senior ONS statistician:
Employment and unemployment levels were both up on the quarter, with the employment rate returning to its joint highest ever. ‘Economically inactive’ people — those who are neither working nor looking for a job — fell by their largest amount in almost five and a half years, however. Total earnings growth continues to nudge upwards in cash terms. However, earnings are still failing to outpace inflation.
An increase in interest rates is likely to put further pressure on indebted households. Even more so as it coincides with the end of the five-year grace period since the launch of the 2013 Help-to-Buy scheme, which means that many new homeowners who come to the end of their five year fixed rate deals, will soon find themselves paying more for their mortgage, while also starting to pay interest on their Help-to-buy government loan.
Will wages grow fast enough in 2018 to outpace inflation (and despite Brexit, which is now only 12 months away)? We shall see.
The President of the United States, Donald Trump, announced recently that he will be pushing ahead with plans to impose a 25% tariff on imports of steel and a 10% tariff on aluminium. This announcement has raised concerns among the USA’s largest trading partners – including the EU, Canada and Mexico, which, according to recent calculations, expect to lose more than $5 billion in steel exports and over $1 billion in aluminium exports.
Source: Bown (2018), Figure 1
A number of economists and policymakers are worried that such policies restrict trade and are likely to provoke retaliation by the affected trade partners. In recent statements, the EU has pledged to take counter-measures if the bloc is affected by these policies. In a recent press conference, the Commissioner for Trade, Cecilia Malmstrom, stated that:
We have made it clear that a move that hurts the EU and puts thousands of European jobs in jeopardy will be met with a firm and proportionate response.
She added that, ‘I truly hope that this will not happen. A trade war has no winners.’
Why is everyone so worried about trade wars then? Trade wars, by definition, result in trade diversion which can hurt employment, wealth creation and overall economic performance in the affected countries. As affected states are almost certain to retaliate, these losses are likely to be felt by all parties that are involved in a trade war – including the one that instigated it. This results in a net welfare loss, the size of which depends on a number of factors, including the relative size of the countries that take part in the trade war, the importance of the affected industries to the local economy and others.
A number of studies have attempted to estimate the effect of trade restrictions and tariff wars on welfare: see for instance Anderson and Wincoop (2001), Syropoulos (2002), Fellbermayr et al. (2013). The results vary widely, depending on the case. However, there seems to be consensus that the more similar (in terms of size and industry composition) the adversaries are, the more mutually damaging a trade war is likely to be (and, therefore, less likely to happen).
As Miyagiwa et al (2016, p43) explain:
A country initiates contingent protection policy against a trading partner only if the latter has a considerably smaller domestic market than its own, while avoiding confrontation with a country having a substantially larger domestic market than its own.
As both Canada and the EU are very large advanced market economies, it remains to be seen how much risk (and potential damage to the local and global economy) US trade policymakers are willing to take.
Coffee chain Starbucks announced last week that it is trialling the introduction a 5p charge for takeaway cups. The proceeds will be donated to environmental charity Hubbub. Starbucks is the first UK coffee chain to make such a move and it hopes that the charge will reduce the use of disposable cups.
Perhaps unwittingly, Starbucks appears to have based its trial on important insights from behavioural economics and this may significantly increase the likelihood that it is successful.
Behavioural economics was thrown into the spotlight last year when one of its leading advocates, Richard Thaler, was awarded the Nobel prize in Economics. However, two of Thaler’s mentors, Amos Tversky and Daniel Kahneman, sowed the seeds for the field of behavioural economics. Most notably, in one of the most cited papers in economics, in 1979 they published a ground breaking alternative to the standard model of consumer choice.
One of the key insights from their model, known as prospect theory, is that rather than simply being concerned with their overall level of wealth, individuals care about gains and losses in wealth relative to a reference point. Furthermore, individuals are loss averse – a loss hurts about twice as much as an equivalent gain makes them feel good.
So how does this help to predict how consumers will react to Starbucks’ trial? Well, crucially, Starbucks is increasing the price of coffee in a takeaway cup. Prospect theory predicts that consumers will see this as a loss relative to the pre-trial price, which serves as a reference point. Since this hurts them a lot, they will be likely to take measures to avoid the levy. In support of this, research undertaken by Starbucks shows that 48% of consumers asked said that they would definitely carry a reusable cup to avoid paying the extra 5p.
As the company’s vice-president of communications, Simon Redfern, made clear, this would be in stark contrast to Starbucks’ previous attempts to reduce waste:
We’ve offered a reusable cup discount for 20 years, with only 1.8% of customers currently taking up this offer.
Furthermore, in 2016 they even experimented with increasing the discount from 25p to 50p. However, the impact on consumer behaviour remained low. Again, this evidence is entirely consistent with prospect theory. If consumers view the discounted price as a gain relative to their reference point, while they would feel some benefit from saving money, this would be felt much less than the equivalent loss would be.
Therefore, it seems likely that introducing a charge for takeaway cups will prove a much better way to reduce waste. More generally, this example demonstrates that the significant insights which prospect and other behavioural theories provide should be taken into account when trying to intervene to influence consumer behaviour in markets.


 The IMF has just published its six-monthly World Economic Outlook. This provides an assessment of trends in the global economy and gives forecasts for a range of macroeconomic indicators by country, by groups of countries and for the whole world.
 The short-term figures are lower than in the USA, France and Germany and reflect ‘the anticipated higher barriers to trade and lower foreign direct investment following Brexit’.
 The second danger is a growth in world government and private debt levels, which at 225% of global GDP are now higher than before the financial crisis of 2007–9. With Trump’s policies of tax cuts and increased government expenditure, the resulting rise in US government debt levels could see some fiscal tightening ahead, which could act as a brake on the world economy. As Maurice Obstfeld , Economic Counsellor and Director of the Research Department, said at the Press Conference launching the latest World Economic Outlook:
 Video and transcript of Press Conference to launch the April 2018 WEO
 I recently found myself talking about my favourite TV shows from my childhood. Smurfs aside, the most popular one for me (and I suppose for many other people from my generation) had to be Knight Rider. It was a story about a crime fighter (David Hasselhoff) and his a heavily modified, artificially intelligent Pontiac Firebird. ‘Kitt’ was a car that could drive itself, engage in thoughtful and articulate conversations, carry out missions and (of course) come up with solutions to complex problems! A car that was very far from what was technologically possible in the 80s – and this was part of its charm.
 Artificial intelligence (AI) is already becoming part of our life. You can buy a robotic vacuum cleaner online for less than a £1000. You can get gadgets like Amazon’s Alexa, that can help you automate your supermarket shopping, for instance. If you are Saudi, you can boast that you are compatriots with a humanoid: Saudi Arabia was the first country to grant citizenship to Sophia, an impressive humanoid and apparently a notorious conversationalist who does not miss an opportunity to address a large audience – and it has done so numerous times already in technology fairs, national congresses – even the UN Assembly! Sophia is the first robot to be honoured with a UN title!
 The last two weeks have been quite busy for macroeconomists, HM Treasury staff and statisticians in the UK. The Chancellor of the Exchequer, Mr Phillip Hammond, delivered his (fairly upbeat) Spring Budget Statement on 13 March, highlighting among other things the ‘stellar performance’ of UK labour markets. According to a
 The President of the United States, Donald Trump, announced recently that he will be pushing ahead with plans to impose a 25% tariff on imports of steel and a 10% tariff on aluminium. This announcement has raised concerns among the USA’s largest trading partners – including the EU, Canada and Mexico, which, according to recent calculations, expect to lose more than $5 billion in steel exports and over $1 billion in aluminium exports.
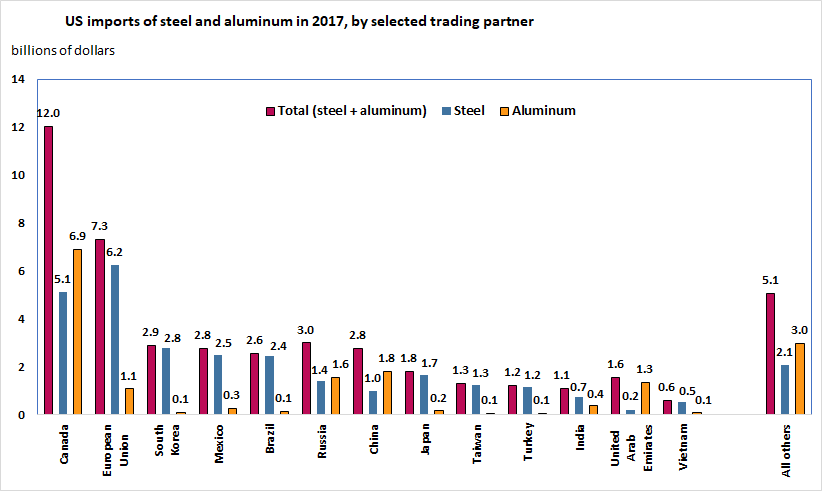
 Why is everyone so worried about trade wars then? Trade wars, by definition, result in trade diversion which can hurt employment, wealth creation and overall economic performance in the affected countries. As affected states are almost certain to retaliate, these losses are likely to be felt by all parties that are involved in a trade war – including the one that instigated it. This results in a net welfare loss, the size of which depends on a number of factors, including the relative size of the countries that take part in the trade war, the importance of the affected industries to the local economy and others.
 Coffee chain Starbucks
  So how does this help to predict how consumers will react to Starbucks’ trial? Well, crucially, Starbucks is increasing the price of coffee in a takeaway cup. Prospect theory predicts that consumers will see this as a loss relative to the pre-trial price, which serves as a reference point. Since this hurts them a lot, they will be likely to take measures to avoid the levy. In support of this,