The Christmas and new year period often draws attention to the financial well-being of households. An important determinant of this is the extent of their indebtedness. Rising levels of debt mean that increasing amounts of households’ incomes becomes prey to servicing debt through repayments and interest charges. They can also result in more people becoming credit constrained, unable to access further credit. Rising debt levels can therefore lead to a deterioration of financial well-being and to financial distress. This was illustrated starkly by events at the end of the 2000s.
The total amount of lending by monetary financial institutions to individuals outstanding at the end of October 2018 was estimated at £1.61 trillion. As Chart 1 shows, this has grown from £408 billion in 1994. Hence, indivduals in the UK have experience a four-fold increase in the levels of debt. (Click here to download a PowerPoint of the chart.)
The debt of individuals is either secured or unsecured. Secured debt is debt secured by property, which for individuals is more commonly referred to as mortgage debt. Unsecured debt, which is also known as consumer credit, includes outstanding debt on credit cards, overdrafts on current accounts and loans for luxury items such as cars and electrical goods. The composition of debt in 2018 is unchanged from that in 1994: 87 per cent is secured debt and 13 per cent unsecured debt.
The fourfold increase in debt is taken by some economists as evidence of financialisation. While this term is frequently defined in distinctive ways depending upon the content in which it is applied, when viewed in very general terms it describes a process by which financial institutions and markets become increasingly important in everyday lives and so in the production and consumption choices that economists study. An implication of this is that in understanding economic decisions, behaviour and outcomes it becomes increasingly important to think about the potential impact of the financial system. The financial crisis is testimony to this.
In thinking about financial well-being, at least at an aggregate level, we can look at the relative size of indebtedness. One way of doing this is to measure the stock of individual debt relative to the annual flow of GDP (national income). This is illustrated in Chart 2. (Click hereto download a PowerPoint of the chart.)
The growth in debt among individuals owed to financial institutions during the 2000s was significant. By the end of 2007, the debt-to-GDP ratio had reached 88 per cent. Decomposing this, the secured debt-to-GDP ratio had reached 75 per cent and the unsecured debt-to-GDP ratio 13 per cent. Compare this with the end of 1994 when secured debt was 46 per cent of GDP, unsecured debt 7 per cent and total debt 53 per cent. In other words, the period between 1994 and 2007 the UK saw a 25 percentage point increase in the debt-to-GDP ratio of individuals.
The early 2010s saw a consolidation in the size of the debt (see Chart 1) which meant that it was not until 2014 that debt levels rose above those of 2008. This led to the size of debt relative to GDP falling back by close to 10 percentage points (see Chart 2). Between 2014 and 2018 the stock of debt has increased from around £1.4 trillion to the current level of £1.61 trillion. This increase has been matched by a similar increase in (nominal) GDP so that the relative stock of debt remains little changed at present at around 76 per cent of GDP.
Chart 3 shows the annual growth rate of net lending (lending net of repayments) by monetary financial institutions to individuals. This essentially captures the growth rate in the stocks of debt, though changes in the actual stock of debt are also be affected by the writing-off of debts. (Click here to download a PowerPoint of the chart.)
We can see quite readily the pick up in lending from 2014. The average annual rate of growth in total net lending since 2014 has been just a little under 3½ per cent. This has been driven by unsecured lending whose growth rate has been close to 8½ per cent per annum, compared to just 2.7 per cent for secured lending. In 2016 the annual growth rate of unsecured lending was just shy of 11 per cent. This helped to fuel concerns about possible future financial distress. These concerns remain despite the annual rate of growth in unsecured debt having eased slightly to 7.5 per cent.
Despite the aggregate debt-to-GDP ratio having been relatively stable of late, the recent growth in debt levels is clearly not without concern. It has to be viewed in the context of two important developments. First, there remains a ‘debt hangover’ from the financial distress experienced by the private sector at the end of the 2000s, which itself contributed to a significant decline in economic activity (real GDP fell by 4 per cent in 2009). This subequently affected the financial well-being of the public sector following its interventions to cushion the economy from the full effects of the economic downturn as well as to help stabilise the financial system. Second, there is considerable uncertainty surrounding the UK’s exit from the European Union.
The financial resilience of all sectors of the economy is therefore of acute concern given the unprecedented uncertainty we are currently facing while, at the same time, we are still feeling the effects of the financial distress from the financial crisis of the late 2000s. It therefore seems timely indeed for individuals to take stock of their stocks of debt.
The latest consumer confidence figures from the European Commission point to consumer confidence in the UK remaining at around its long-term average. Despite this, confidence is markedly weaker than before the outcome of the EU referendum. Yet, the saving ratio, which captures the proportion of disposable income saved by the household sector, is close to its historic low. We consider this apparent puzzle and whether we can expect the saving ratio to rise.
The European Commission’s consumer confidence measure is a composite indicator based on the balance of responses to 4 forward-looking questions relating to the financial situation of households, the general economic situation, unemployment expectations and savings.
Chart 1 shows the consumer confidence indicator for the UK. The long-term average (median) of –6.25 shows that negative responses across the four questions typically outweigh positive responses. In October 2018 the confidence balance stood at –5.2, essentially unchanged from its September value of –5.8. While above the long-term average, recent values mark a weakening in confidence from levels before the EU referendum. At the beginning of 2016 the aggregate confidence score was running at around +4. (Click here to download a PowerPoint of the chart.)
Chart 1 shows two periods where consumer confidence fell markedly. The first was in the early 1990s. In 1990 the UK joined the Exchange Rate Mechanism (ERM). This was a semi-fixed exchange rate system whereby participating EU countries allowed fluctuations against each other’s currencies, but only within agreed bands, while being able to collectively float freely against all other currencies. In attempting to staying in the ERM, the UK was obliged to raise interest rates in order to protect the pound. The hikes to rates contributed to a significant dampening of aggregate demand and the economy slid into recession. Britain crashed out of the ERM in September 1992.
The second period of declining confidence was during the global financial crisis in the late 2000s. The retrenchment among financial institutions meant a significant tightening of credit conditions. This too contributed to a significant dampening of aggregate demand and the economy slid into recession. Whereas the 1992 recession saw the UK national output contract by 2.0 percent, this time national output fell by 6.3 per cent.
The collapses in confidence from 1992 and from 2007/08 are likely to have helped propagate the effects of the fall in aggregate demand that were already underway. The weakening of confidence in 2016 is perhaps a better example of a ‘confidence shock’, i.e. a change in aggregate demand originating from a change in confidence. Nonetheless, a fall in confidence, whether it amplifies existing shocks or is the source of the shock, is often taken as a signal of greater economic uncertainty. If we take this greater uncertainty to reflect a greater range of future income outcomes, including potential income losses, then households may look to insure themselves by increasing current saving.
It is usual to assume that people suffer from diminishing marginal utility of total consumption. This means that while total satisfaction increases as we consume more, the additional utility from consuming more (marginal utility) decreases. An implication of this is that a given loss of consumption reduces utility by more than an equivalent increase in consumption increases utility. This explains why people prefer more consistent consumption levels over time and so engage in consumption smoothing. The utility, for example, from an ‘average’ consumption level across two time periods, is higher, than the expected utility from a ‘low’ level of consumption in period 1 and a ‘high’ level of consumption in period 2. This is because the loss of utility from a ‘low’ level of consumption relative to the ‘average’ level is greater than the additional utility from the ‘high’ level relative to the ‘average’ level.
If greater uncertainty, such as that following the EU referendum, increases the range of possible ‘lower’ consumption values in the future even when matched by an increase in the equivalent range of possible ‘higher’ consumption values, then expected future utility falls. The incentive therefore is for people to build up a larger buffer stock of saving to minimise utility losses if the ‘bad state’ occurs. Hence, saving which acts as a from of self-insurance in the presence of uncertainty is known as buffer-stock saving or precautionary saving.
Chart 2 plots the paths of the UK household-sector saving ratio and consumer confidence. The saving ratio approximates the proportion of disposable income saved by the household sector. What we might expect to see if more uncertainty induces buffer-stock saving is for falls in confidence to lead to a rise in the saving ratio. Conversely, less uncertainty as proxied by a rise in confidence would lead to a fall in the saving ratio. (Click here to download a PowerPoint of the chart.)
The chart provides some evidence that of this. The early 1990s and late 2000s certainly coincided with both waning confidence and a rising saving ratio. The saving ratio rose to as high as 15.2 per cent in 1993 and 12.0 per cent in 2009. Meanwhile the rising confidence seen in the late 1990s coincided with a fall in the saving ratio to 4.7 per cent in 1999.
As Chart 2 shows, the easing of confidence since 2016 has coincided with a period where the saving ratio has been historically low. Across 2017 the saving ratio stood at just 4.5 per cent. In the first half of 2018 the ratio averaged just 4.2 per cent. While the release of the official figures for the saving ratio are less timely than those for confidence, the recent very low saving ratio may be seen to raise concerns. Can softer confidence data continue to co-exist with such a low saving ratio?
There are a series of possible explanations for the recent lows in the saving ratio. On one hand, the rate of price inflation has frequently exceeded wage inflation in recent years so eroding the real value of earnings. This has stretched household budgets and limited the amount of discretionary income available for saving. On the other hand, unemployment rates have fallen to historic lows. The rate of unemployment in the three months to August stood at 4 per cent, the lowest since 1975. Unemployment expectations are important in determining levels of buffer stock saving because of the impact of unemployment on household budgets.
Another factor that has fuelled the growth of spending relative to income, has been the growth of consumer credit. In the period since July 2016, the annual rate of growth of consumer credit, net of repayments, has averaged 9.7 per cent. Behavioural economists argue that foregoing spending can be emotionally painful. Hence, spending has the potential to exhibit more stickiness than might otherwise be predicted in a more uncertain environment or in the anticipation of income losses. Therefore, the reluctance or inability to wean ourselves off credit and spending might be a reason for the continuing low saving ratio.
We wait to see whether the saving ratio increases over the coming months. However, for now, the UK household sector appears to be characterised by low saving and fragile confidence. Whether or not this is a puzzle, is open to question. Nonetheless, it does appear to carry obvious risks should weaker income growth materialise.
Draw up a series of factors that you think might affect consumer confidence.
Which of the following statements is likely to be more accurate: (a) Consumer confidence drives economic activity or (b) Economic activity drives consumer confidence?
What macroeconomic indicators would those compiling the consumer confidence indicator expect the indicator to predict?
How does the diminishing marginal utility of consumption (or income) help explain why people engage in buffer stock saving (precautionary saving)?
How might uncertainty affect consumer confidence?
How does greater income uncertainty affect expected utility? What affect might this have on buffer stock saving?
Policymakers around the world have used Gross Domestic Product as the main gauge of economic performance – and have often adopted policies that aim to maximise its rate of growth. Generation after generation of economists have committed significant time and effort to thinking about the factors that influence GDP growth, on the premise that an expanding and healthy economy is one that sees its GDP increasing every year at a sufficient rate.
But is economic output a good enough indicator of national economic wellbeing? Costanza et al (2014) (see link below) argue that, despite its merits, GDP can be a ‘misleading measure of national success’:
GDP measures mainly market transactions. It ignores social costs, environmental impacts and income inequality. If a business used GDP-style accounting, it would aim to maximize gross revenue — even at the expense of profitability, efficiency, sustainability or flexibility. That is hardly smart or sustainable (think Enron). Yet since the end of the Second World War, promoting GDP growth has remained the primary national policy goal in almost every country. Meanwhile, researchers have become much better at measuring what actually does make life worthwhile. The environmental and social effects of GDP growth is a misleading measure of national success. Countries should act now to embrace new metrics.
The limitations of GDP growth as a measure of economic wellbeing and national strength are becoming increasingly clear in today’s world. Some of the world’s wealthiest countries are plagued by discontent, with a growth in populism and social discontent – attitudes which are often fuelled by high rates of poverty and economic hardship. In a recent report titled ‘The Living Standards Audit 2018’ published by the Resolution Foundation, a UK economic thinktank (see link below), the authors found that child poverty rose in 2016–17 as a result of declining incomes of the poorest third of UK households:
While the economic profile of UK households has changed, living standards – with the exception of pensioner households – have mostly stagnated since the mid-2000s. Typical household incomes are not much higher than they were in 2003–04. This stagnation in living standards for many has brought with it a rise in poverty rates for low to middle income families. Over a third of low to middle income families with children are in poverty, up from a quarter in the mid-2000s, and nearly two-fifths say that they can’t afford a holiday away for their children once a year. On the other hand, the share of non-working families in poverty has fallen, though not by enough to prevent an overall rise in poverty since 2010.
Their projections also show that this rise in poverty was likely to have continued in 2017–18:
Although the increase in broad measures of inequality were relatively muted last year, our nowcast suggests that there was a pronounced rise in poverty (measured after housing costs[…]. The increase in overall poverty (from 22.1 to 23.2 per cent) was the largest since 1988. But this was dwarfed by the increase in child poverty, which rose from 30.3 per cent to 33.4 per cent. […]The fortunes of middle-income households diverged from those towards the bottom of the distribution and so a greater share of households, and children, found themselves below the poverty threshold.
A simple literature search on Scope (or even Google Scholar) shows that there has been a significant increase in the number of journal articles and reports in the last 10 years on this topic. We do talk more about the limitations of GDP, but we are still using it as the main measure of national economic performance.
Is it then time to stop focusing our attention on GDP growth exclusively and start considering broader metrics of social development? And what would such metrics look like? Both interesting questions that we will try to address in coming blogs.
Hearing before the Subcommittee on Interstate Commerce, Trade, and Tourism of the United States Senate Committee on Commerce, Science and Transportation (12/3/08)
Questions
What are the main strengths and weakness of using GDP as measure of economic performance?
Is high GDP growth alone enough to foster economic and social wellbeing? Explain your answer using examples.
Write a list of alternative measures that could be used alongside GDP-based metrics to measure economic and social progress. Explain your answer.
Ten years ago, the financial crisis deepened and stock markets around the world plummeted. The trigger was the collapse of Lehman Brothers, the fourth-largest US investment bank. It filed for bankruptcy on September 15, 2008. This was not the first bank failure around that time. In 2007, Northern Rock in the UK (Aug/Sept 2007) had collapsed and so too had Bear Stearns in the USA (Mar 2008).
Initially there was some hope that the US government would bail out Lehmans. But when Congress rejected the Bank Bailout Bill on September 29, the US stock market fell sharply, with the Dow Jones falling by 7% the same day. This was mirrored in other countries: the FTSE 100 fell by 15%.
At the core of the problem was excessive lending by banks with too little capital. What is more, much of the capital was of poor quality. Many of the banks held securitised assets containing ‘sub-prime mortgage debt’. The assets, known as collateralised debt obligations (CDOs), were bundles of other assets, including mortgages. US homeowners had been lent money based on the assumption that their houses would increase in value. When house prices fell, homeowners were left in a position of negative equity – owing more than the value of their house. With many people forced to sell their houses, prices fell further. Mortgage debt held by banks could not be redeemed: it was ‘sub-prime’ or ‘toxic debt’.
Response to the crisis
The outcome of the financial crash was a series of bailouts of banks around the world. Banks cut back on lending and the world headed for a major recession.
Initially, the response of governments and central banks was to stimulate their economies through fiscal and monetary policies. Government spending was increased; taxes were cut; interest rates were cut to near zero. By 2010, the global economy seemed to be pulling out of recession.
However, the expansionary fiscal policy, plus the bailing out of banks, had led to large public-sector deficits and growing public-sector debt. Although a return of economic growth would help to increase revenues, many governments felt that the size of the public-sector deficits was too large to rely on economic growth.
As a result, many governments embarked on a period of austerity – tight fiscal policy, involving cutting government expenditure and raising taxes. Although this might slowly bring the deficit down, it slowed down growth and caused major hardships for people who relied on benefits and who saw their benefits cut. It also led to a cut in public services.
Expanding the economy was left to central banks, which kept monetary policy very loose. Rock-bottom interest rates were then accompanied by quantitative easing. This was the expansion of the money supply by central-bank purchases of assets, largely government bonds. A massive amount of extra liquidity was pumped into economies. But with confidence still low, much of this ended up in other asset purchases, such as stocks and shares, rather than being spent on goods and services. The effect was a limited stimulation of the economy, but a surge in stock market prices.
With wages rising slowly, or even falling in real terms, and with credit easy to obtain at record low interest rates, so consumer debt increased.
Lessons
So have the lessons of the financial crash been learned? Would we ever have a repeat of 2007–9?
On the positive side, financial regulators are more aware of the dangers of under capitalisation. Banks’ capital requirements have increased, overseen by the Bank for International Settlements. Under its Basel II and then Basel III regulations (see link below), banks are required to hold much more capital (‘capital buffers’). Some countries’ regulators (normally the central bank), depending on their specific conditions, exceed these the Basel requirements.
But substantial risks remain and many of the lessons have not been learnt from the financial crisis and its aftermath.
There has been a large expansion of household debt, fuelled by low interest rates. This constrains central banks’ ability to raise interest rates without causing financial distress to people with large debts. It also makes it more likely that there will be a Minsky moment, when a trigger, such as a trade war (e.g. between the USA and China), causes banks to curb lending and consumers to rein in debt. This can then lead to a fall in aggregate demand and a recession.
Total debt of the private and public sectors now amounts to $164 trillion, or 225% of world GDP – 12 percentage points higher than in 2009.
China poses a considerable risk, as well as being a driver of global growth. China has very high levels of consumer debt and many of its banks are undercapitalised. It has already experienced one stock market crash. From mid-June 2015, there was a three-week fall in share prices, knocking about 30% off their value. Previously the Chinese stock market had soared, with many people borrowing to buy shares. But this was a classic bubble, with share prices reflecting exuberance, not economic fundamentals.
Although Chinese government purchases of shares and tighter regulation helped to stabilise the market, it is possible that there may be another crash, especially if the trade war with the USA escalates even further. The Chinese stock market has already lost 20% of its value this year.
Then there is the problem with shadow banking. This is the provision of loans by non-bank financial institutions, such as insurance companies or hedge funds. As the International Business Times article linked below states:
A mind-boggling study from the US last year, for example, found that the market share of shadow banking in residential mortgages had rocketed from 15% in 2007 to 38% in 2015. This also represents a staggering 75% of all loans to low-income borrowers and risky borrowers. China’s shadow banking is another major concern, amounting to US$15 trillion, or about 130% of GDP. Meanwhile, fears are mounting that many shadow banks around the world are relaxing their underwriting standards.
Another issue is whether emerging markets can sustain their continued growth, or whether troubles in the more vulnerable emerging-market economies could trigger contagion across the more exposed parts of the developing world and possibly across the whole global economy. The recent crises in Turkey and Argentina may be a portent of this.
Then there is a risk of a cyber-attack by a rogue government or criminals on key financial insitutions, such as central banks or major international banks. Despite investing large amounts of money in cyber-security, financial institutions worry about their vulnerability to an attack.
Any of these triggers could cause a crisis of confidence, which, in turn, could lead to a fall in stock markets, a fall in aggregate demand and a recession.
Finally there is the question of the deep and prolonged crisis in capitalism itself – a crisis that manifests itself, not in a sudden recession, but in a long-term stagnation of the living standards of the poor and ‘just about managing’. Average real weekly earnings in many countries today are still below those in 2008, before the crash. In Great Britain, real weekly earnings in July 2018 were still some 6% lower than in early 2008.
Explain the major causes of the financial market crash in 2008.
Would it have been a good idea to have continued with expansionary fiscal policy beyond 2009?
Summarise the Basel III banking regulations.
How could quantitative easing have been differently designed so as to have injected more money into the real sector of the economy?
What are the main threats to the global economy at the current time? Are any of these a ‘hangover’ from the 2007–8 financial crisis?
What is meant by ‘shadow banking’ and how might this be a threat to the future stability of the global economy?
Find data on household debt in two developed countries from 2000 to the present day. Chart the figures. Explain the pattern that emerges and discuss whether there are any dangers for the two economies from the levels of debt.
Would you start a family if you were pessimistic about the future of the economy? Buckles et al (2017) (see link below) believe that fewer of us would do so and, therefore, fertility rates could be used by investors and central banks as an early signal to pick up subtle changes in consumer confidence and overall economic climate.
Their study titled ‘Fertility is a leading economic indicator’ uses ‘live births’ data, sourced from US birth certificates, to explore if there is any association between fertility changes (measured as the rate of change in number of births) and GDP growth. Their results suggest that, in the case of the USA, there is: dips in fertility rates tend to precede by several quarters slowdown in economic activity. As the authors state:
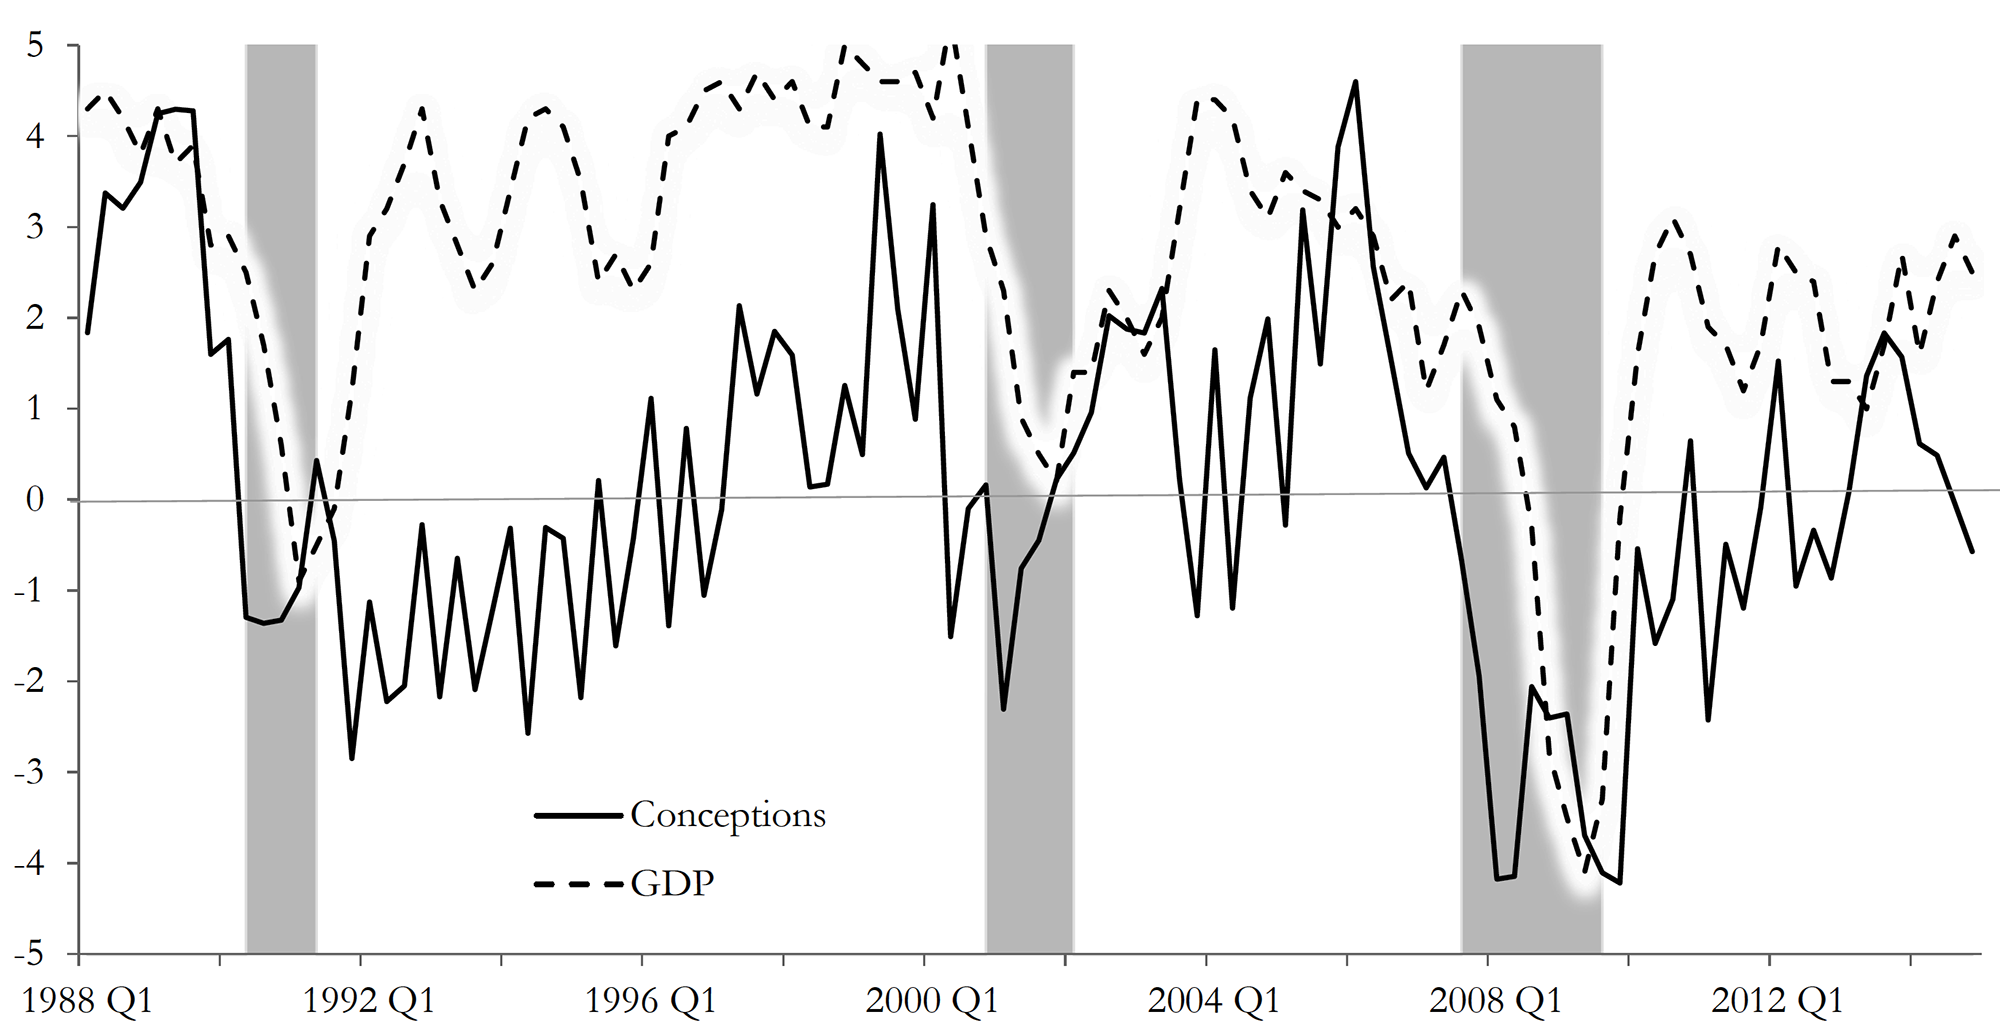
The growth rate of conceptions declines prior to economic downturns and the decline occurs several quarters before recessions begin. Our measure of conceptions is constructed using live births; we present evidence suggesting that our results are indeed driven by changes in conceptions and not by changes in abortion or miscarriage. Conceptions compare well with or even outperform other economic indicators in anticipating recessions.
Conception and GDP Growth Rates (source Buckles et al p33: see below)
Although this is not the first piece of academic writing to claim that fertility has pro-cyclical qualities (see for instance, Adsera (2004, 2011), Adsera and Menendez (2011), Currie and Schwandt (2014) and Chatterjee and Vogle (2016) linked below), it is, to the best of our knowledge, the most recent paper (in terms of data used) to depict this relationship and to explore the suitability of fertility as a macroeconomic indicator to predict recessions.
Economies, after all, are groups of people who participate actively in day-to-day production and consumption activities – as consumers, workers and business leaders. Changes in their environment should affect their expectations about the future.
Are people, however, forward-looking enough to guide their current behaviours by their expectations of future economic outcomes? They may be, according to the findings of this study.
Did you know, for instance, that sales of ties tend to increase in economic downturns, as men buy more ties to show that they are working harder, in fear of losing their job[1]? But this is probably a topic for another blog.
Give two reasons why fertility rates may be a good indicator of economic activity.
Give two reasons why fertility rates may NOT be a good indicator of economic activity.
Do a literature search to identify and explain an ‘unorthodox’ macroeconomic indicator of your choice, and how it has been used to track economic activity.
 The total amount of lending by monetary financial institutions to individuals outstanding at the end of October 2018 was estimated at £1.61 trillion. As Chart 1 shows, this has grown from £408 billion in 1994. Hence, indivduals in the UK have experience a four-fold increase in the levels of debt. (Click here to download a PowerPoint of the chart.)
 In thinking about financial well-being, at least at an aggregate level, we can look at the relative size of indebtedness. One way of doing this is to measure the stock of individual debt relative to the annual flow of GDP (national income). This is illustrated in Chart 2. (Click hereto download a PowerPoint of the chart.)
 Chart 3 shows the annual growth rate of net lending (lending net of repayments) by monetary financial institutions to individuals. This essentially captures the growth rate in the stocks of debt, though changes in the actual stock of debt are also be affected by the writing-off of debts. (Click here to download a PowerPoint of the chart.)
 Chart 1 shows the consumer confidence indicator for the UK. The long-term average (median) of –6.25 shows that negative responses across the four questions typically outweigh positive responses. In October 2018 the confidence balance stood at –5.2, essentially unchanged from its September value of –5.8. While above the long-term average, recent values mark a weakening in confidence from levels before the EU referendum. At the beginning of 2016 the aggregate confidence score was running at around +4. (Click
  Chart 2 plots the paths of the UK household-sector saving ratio and consumer confidence. The saving ratio approximates the proportion of disposable income saved by the household sector. What we might expect to see if more uncertainty induces buffer-stock saving is for falls in confidence to lead to a rise in the saving ratio. Conversely, less uncertainty as proxied by a rise in confidence would lead to a fall in the saving ratio. (Click
  Policymakers around the world have used Gross Domestic Product as the main gauge of economic performance – and have often adopted policies that aim to maximise its rate of growth. Generation after generation of economists have committed significant time and effort to thinking about the factors that influence GDP growth, on the premise that an expanding and healthy economy is one that sees its GDP increasing every year at a sufficient rate.
  The limitations of GDP growth as a measure of economic wellbeing and national strength are becoming increasingly clear in today’s world. Some of the world’s wealthiest countries are plagued by discontent, with a growth in populism and social discontent – attitudes which are often fuelled by high rates of poverty and economic hardship. In a recent report titled ‘The Living Standards Audit 2018’ published by the
  Ten years ago, the financial crisis deepened and stock markets around the world plummeted. The trigger was the
  Expanding the economy was left to central banks, which kept monetary policy very loose. Rock-bottom interest rates were then accompanied by quantitative easing. This was the expansion of the money supply by central-bank purchases of assets, largely government bonds. A massive amount of extra liquidity was pumped into economies. But with confidence still low, much of this ended up in other asset purchases, such as stocks and shares, rather than being spent on goods and services. The effect was a limited stimulation of the economy, but a surge in stock market prices.
 Then there is a risk of a cyber-attack by a rogue government or criminals on key financial insitutions, such as central banks or major international banks. Despite investing large amounts of money in cyber-security, financial institutions worry about their vulnerability to an attack.