 Life expectancy is increasing across the world and the latest set of figures from the Office for National Statistics show that in the UK it has passed 79 for boys born in 2010–12, and 82 for girls born then. In fact the prediction is that over a third of babies born in 2013 will live to more than 100. The data throws up some interesting questions. How well prepared are we for lives that last this long? And how evenly distributed is this increase in life expectancy? Pensions’ minister, Steve Webb, has called for better information on life expectancy to be shared. How would this impact on our decision making?
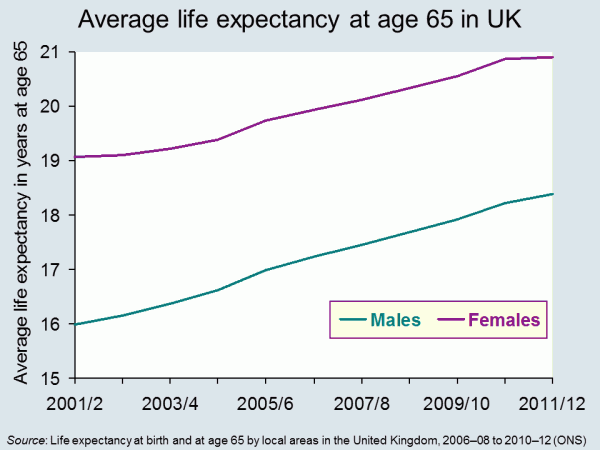
It seems reasonable to think that increasing life expectancy must be good news. And of course, for individuals it can be. In 1951 the average man retiring at 65, in England and Wales, could expect to live and draw a pension for another 12.1 years. By 2014 this had risen to 22 years.
 But while we can look forward to longer life, for the government, it presents some challenges The first is that we just don’t save enough for our old age. This seems to be partly because we find it hard to make decisions that will have an impact so far in the future. There are a number of measures that have been put in place to encourage us to save more, including auto-enrolment into company pension schemes. This is being rolled out across businesses over the next three years. In the 2014 Budget, the Chancellor announced that people reaching retirement age will be able to draw all their pension as a cash lump sum, rather than having to take it as a regular income.
Another concern for government is the variations that we find in life expectancy across the UK. The 2014 ONS data identified that life expectancy for men born in Glasgow in 2012 is 72.6, in East Dorset it is 82.9. 25% of those in Glasgow are not expected to live to 65. The gap in years of good health is even greater. This presents governments with a long-term problem. How do they achieve greater equality in this instance? Do they focus resources on the areas that need it most? Do they legislate to address behaviour? Or do they rely on the provision of good advice – on diet, exercise and other factors?
Information has a role to play in both areas identified above. In April 2014, Steve Webb, suggested that in order to make good decisions at the point of retirement, people need to understand more about what lies ahead. He said:
People tend to underestimate how long they’re likely to live, so we’re talking about averages, something very broad-brush. Based on your gender, based on your age, perhaps asking one or two basic questions, like whether you’ve smoked or not, you can tell somebody that they might, on average, live for another 20 years or so.
This suggestion has led to some concerns being expressed at what appears to be an over-simplistic approach. Estimates can only be based on a mix of averages modified by individual information. Would the projections be shared with pension providers? What would you do if you exceeded your forecast life expectancy – by a long way – and had spent all your money? Could you sue someone?
Will your pension pot last as long as you will? The Telegraph, Dan Hyde and Richard Dyson (23/4/2014)
Scientists invent death test that will tell us how long we have to live Metro (11/8/13)
Games host Glasgow has worst life expectancy in the UK The Guardian, Caroline Davies (16/4/2014)
Pensioners could get life expectancy guidance BBC News Politics (17/4/14)
ONS reveals gaps in life expectancy across the UK FT Adviser Pensions, Kevin White (23/4/14)
Health care aid for developing countries boosts life expectancy Health Canal, Ruth Ann Richter (22/4/14)
A third of babies born this year will live to 100 This is Money.co.uk, Adam Uren (11/12/13)
Questions
- Thinking about the UK, what are the factors that might explain variations in life expectancy across different regions? How might the government address these differences? Why would they want to do so?
- Do the same factors explain variations between countries? Who can address these differences? Who would want to do so?
- If you could have a reasonable prediction of your life expectancy at 65, would you want it? How would your behaviour change if you were predicted a longer than average life expectancy? How would it change if you were predicted a shorter than average life expectancy?
- If you could have an accurate prediction of your life expectancy at 18, how would your answers differ? If this were possible, would it present any problems?
 Rising inflation: not normally a cause for celebration, but that’s not the case for Japan. Having been subject to the spectre of deflation for many years, the 22-year high for the CPI at 2.7% is a welcome figure, even it is slightly lower than expected. This surge in prices is partly the result of a growth in domestic demand and a sign, therefore, that output will expand in response to the rise in demand.
The Japanese economy has experienced largely stagnant growth for two decades and a key cause has been falling prices. Although consumers like bargains, this has been problematic for this large economy. Deflation creates continuously falling prices and this means consumers hold back from purchasing durable goods, preferring to wait until prices have fallen further.

In the blog, Japan’s recovery, we looked at inflation data showing Japanese consumer prices growing at a faster rate than expected. This ‘positive’ trend has continued.
When it comes to inflation, expectations are crucial. If people think prices will rise in the future, they are more likely to buy now to get the lower price. This can therefore help to stimulate aggregate demand and it is this that has been the target for Japan. Part of the growth in the CPI is down to the sales tax rise from 5% to 8%. This was the first time in 17 years that the sales tax had increased. Further increases in it are expected in 2015. There were concerns about the impact of this rise, based on the depression that followed the last rise back in 1997, but so far the signs seem good.
Monetary easing was a key component in ending the downward trajectory of the Japanese economy and, following the sales tax rise, many believe that another round of monetary easing may be needed to counter the effects and create further growth in the economy and in the CPI. As the Bank of Japan Governor said:
There are various ways to adjust policy. We will decide what among these measures is appropriate depending on economic and price developments at the time … For now, we can say Japan is making steady progress toward achieving 2 per cent inflation.
One of the ‘three arrows‘ of the government’s policy has been to boost government spending, which should directly increase aggregate demand. Furthermore, with signs of the CPI rising, consumers may be encouraged to spend more, giving a much needed boost to consumption. The economy is certainly not out of the woods, but appears to be on the right path. The following articles consider the Japanese economy.
Japan CPI rises less than expected Wall Street Journal, Takashi Nakamichi (25/4/14)
Japan inflation may beat BOJ forecast Reuters, Leika Kihara (22/4/14)
Tokyo consumer price growth at 22-year high BBC News (25/4/14)
Japan inflation quickens to over 5-year high, output rebounds Reuters, Leika Kihara and Stanley White (31/1/14)
Japan’s consumer inflation set to reach five-year high Guardian (18/4/14)
Tokyo inflation hits 22-year high, inching toward BOJ goal Reuters, Tetsushi Kajimoto and Leika Kihara (25/4/14)
Tokyo’s core CPI got 2.7% lift in April from tax hike The Japan Times (25/4/14)
Is Japan winning the war against deflation? CNBC, Ansuya Harjani (25/4/14)
Questions
- Why is deflation a problem?
- Using an AD/AS diagram, illustrate the problem of expectations and how this contributes to stagnant growth.
- Use the same diagram to explain how expectations of rising prices can help to boost AD.
- Why is the sales tax expected to reduce growth?
- Why is another round of monetary easing expected?
- What government policies would you recommend to a government faced with stagnant growth and falling prices?
 Calls for an independent Scotland have focused on a variety of economic issues. These have included taxation, government spending, currency, fiscal policy and monetary policy. However, the BBC News article below looks at another factor which may be affected by a ‘yes’ vote – the price of stamps.
Having just returned from 10 days in the Highlands, I certainly agree with the BBC article that it would be an expensive business to deliver to the remotest parts of Scotland and would definitely require ‘trains, planes, ferries, Land Rovers and vans’ and, in an extreme case, a fishing boat.
So is the price we pay for postage to less rural areas of the UK used to subsidise the higher costs of delivery to the remotest parts of Scotland and, in particular, to the small islands off the Scottish coastline? What would a ‘yes’ vote mean for the cost of stamps in Scotland and in the remainder of the UK? The following articles consider this rather odd question.
Why postage should be cheaper in UK if Scots vote ‘Yes’ BBC News, Brian Milligan (19/4/14)
Tories warn over post service costs The Courier (6/4/14)
Questions
- What happened when the Royal Mail was privatised?
- What are the benefits and costs of privatisation?
- Using a cost and revenue diagram, explain how the different costs of delivery between urban parts of the UK and the remotest parts of Scotland should be reflected in different prices of postage.
- If the price of postage is the same for delivery everywhere in the UK, use your diagram to explain how this happens.
- What does your diagram suggest will happen to the price of postage stamps if a ‘subsidy’ is no longer available?
 Officials of the Club Financial Control Body (CFCB) of UEFA met on Tuesday 15th April and Wednesday 16th April to decide the fate of a number of European clubs. The job of the CFCB is to implement UEFA’s Financial Fair Play (FFP) rules. Manchester City and Paris Saint-Germain (PSG) are said to be nervously awaiting the outcome of these meetings.
UEFA’s FFP rules apply to teams who want to play in either the Champions League or the Europa League. In order to be eligible to compete in these competitions teams not only have to perform well in their domestic league they also have to obtain a license from UEFA. The application process normally takes place midway through the current season for entry into either the Champions League or Europa League for the following season.
UEFA’s FFP rules cover a broad range of issues such as requirements for clubs to pay taxes, transfer fees and players’ wages on time in order to receive a license. However it is the ‘Break Even’ requirement that has caught the attention of a number of economists. This provision limits the size of the financial losses that team can incur before they become subject to sanctions from UEFA. Some of the stated aims of the policy are to:
– Introduce more discipline and rationality in club football finances
– Encourage clubs to operate on the basis of their own revenues
– Encourage responsible spending for the long-term benefit of football
– Protect the long term viability and sustainability of European club football.
The Royal Economic Society held a special session on the potential impact of the ‘Break Even’ requirement at its annual conference in April of this year.
One key way in which the UEFA rules differ from the rules imposed in the Championship in England is that the financial performance of the clubs is judged over a 2/3 year period rather than just one. The initial assessment period is over 2 seasons – 2011-12 to 2012-13. After this the monitoring period is over 3 seasons. Teams can make an initial loss of €5 million in total over the first two year period but this can increase to a maximum permitted loss €45 million over the two years – approximately £37 million – if the team’s owner is willing to fund this loss out of their own money. Certain categories of expenditure are exempt such as the cost of building a new stadium/stand or spending on youth development and the local community.
Manchester City made a total financial loss of £149 million over the last two seasons, far in excess of the permitted £37million, but these losses are falling which may count in their favour. They made losses of £97.9 million in 2012 and £51.6 million in 2013. Also some of the club’s expenditure will have been on some of the exempted categories so that the actual losses subject to FFP will be lower. Chelsea made a profit of £1.4million in 2011-12 and a loss of £49.4million in 2012-13. Although the losses over the two seasons were greater than £37 million, once adjustments were made for exempted expenditures the club was within the maximum permitted loss so was not subject to a full investigation.
In order to implement its FFP regulations UEFA created the Club Financial Control Body (CFCB). The CFCB has two departments – an investigatory chamber and an adjudicatory chamber. The investigatory chamber does the bulk of the work by investigating the accounts of all the 237 clubs that play in UEFA competitions. It was initially reported that the accounts of 76 clubs were being investigated in some detail because it was thought that they might have failed to meet FFP guidelines. However after further investigations in February it was reported that this number had fallen to below 20 teams. The investigatory panel met on Tuesday 15th April and Wednesday 16th April in order to make its final decisions which will be announced May 5th. The body can choose from one of the four following options in each case:
– Dismiss the case
– Agree a settlement with the club – effectively putting it on probation
– Reprimand and fine the club up to €100,000
– Refer the club to the CFCB adjudicatory chamber
The last option is the most serious as the adjudicatory chamber has the power to issue more serious penalties such as
– A deduction of points from the group stages of UEFA competitions.
– Withholding of revenues from UEFA competitions.
– Restrictions on the number of players that a club can register for participation in UEFA competitions.
– Disqualification from future UEFA competitions.
One issue that concerned UEFA was the possibility that very wealthy team owners might try to artificially inflate the revenues their club’s generate so as to circumvent the rules and make it look as if the team was meeting the FFP guidelines. In particular deals might be struck between other organisations that the club owner has an interest in and the football club at rates far in excess of the normal market level. For example some concerns have been expressed about the nature of the back-dated sponsorship deal of £167 million/year signed by PSG with the Qatar Tourism Authority. PSG are owned by Qatar Sport Investment which itself is a joint venture between the Qatari government and the Qatari Olympic Committee. The CFCB have said that they will analyse these types of deals and adjust club accounts if necessary so that they reflect true market rates.
May 5th could prove to be a very significant day for some of the biggest and most wealthy clubs in Europe.
Webcast
 The Economics of “Financial Fair Play” (FFP) in European Soccer (EJ Special Session) Royal Economic Society (7/4/14)
Articles
UEFA probes ‘fewer than 20’ clubs over financial fair play rules Sky Sports, (14/4/14)
Manchester City confident of satisfying Uefa financial fair play rules The Guardian (15/4/14)
Uefa’s Financial Fair Play rules explained The Telegraph (15/4/14)
Man City sweating over sanctions as UEFA prepare to rule over excessive spending Daily Mail (15/4/14)
How Bosman’s lawyer is plotting another football revolution BBC Sport (2/10/13)
Manchester City await fate as Uefa’s financial rules kick in BBC Sport (16/4/14)
Manchester City and Paris Saint-Germain face financial fair play fate The Guardian (14/4/14) .
Questions
- In standard economic theory it is assumed that both consumers and producers act rationally. What precisely does this mean?
- One of the stated aims of UEFA FFP is to ‘introduce more discipline and rationality in club football finances’. Why might the owners of a football club act in an irrational way?
- Consider some of the advantages and disadvantages of assessing the financial performance of a team over 3 years as opposed to 1 year.
- One of the major arguments made against the UEFA FFP rules is that they will lead to a ‘fossilisation’ of the existing market i.e. the current top clubs are more likely to maintain their leadership. Explain the logic of this argument in more detail.
- Which of the possible sanctions for breaking FFP regulations do you think would hit the clubs the hardest in terms of the revenue they would lose? i.e. Which of the sanctions would they most like to avoid?
 As Leicester City celebrated promotion to the English Premier League (EPL) last Saturday (5th April) it also became the first club in England that will probably have to pay a new Financial Fair Play (FFP) Tax. This tax is not paid to the government, but is effectively a fine imposed by the English Football League (EFL) on teams who break FFP regulations.
On Tuesday 8th April 2014 representatives from all the Championship clubs met with officials from the English Football League (EFL) in order to discuss the implementation of FFP. It had been reported in February that a number of teams were unhappy about the implementation of the FFP rules and were threatening to take legal action against the league. Unsurprisingly, one of these clubs was rumoured to be Leicester City.
In April 2012, 21 out of the 24 clubs in the Championship agreed on a set of new FFP regulations. These rules place a limit on the size of any financial losses that a team can incur in a given season before punishments, such as a tax, are imposed on them. The English Football League (EFL) stated that the aim of the FFP regulations was to
reduce the levels of losses being incurred at some clubs and, over time, establish a league of financially self-sustaining professional football clubs.
Under the agreed set of rules, all teams in the Championship have to provide a set of annual accounts by 1st December for the previous season: i.e. the first reporting period was in December 2012, when clubs had to submit accounts for 2011–12. No penalties were applied for the first two reporting periods as teams were given time to adjust to the new FFP framework. However sanctions come into effect for the 2013–14 season.
For the 2013–14 season the FFP rules set a threshold of £3 million as the size of the pre-tax financial losses that a team can incur before having to face any sanctions. If a team incurs a pre-tax loss of greater than £3 million but less than £8 million then punishments from the league can be avoided if the team’s owner invests enough money into the club so that the loss is effectively limited to £3 million: i.e. if the club reports a loss of £7 million then the owner would have to invest a minimum of £4 million of his/her own cash to avoid any sanctions.
The club is not allowed to finance the loss by borrowing or adding to the level of the team’s debt. If the owner cannot/refuses to make the investment or the pre-tax loss is greater than £8 million then the team is subject to one of two possible sanctions depending on whether it is promoted or not.
First, if the club is not promoted to the EPL, then it is subject to a transfer ban from the 1st January 2015: i.e. it will be unable to sign new players at the start of the transfer window. The ban remains in place until the club is able to submit financial information that clearly shows that it is meeting the FFP guidelines.
Second, if the club is promoted to the EPL then instead of a transfer embargo it has to pay the FFP Tax. The amount of tax the firm has to pay to the league depends on the size of the financial loss it has incurred. The larger the loss, the greater the tax it has to pay. The marginal rate of tax also increases with the size of the loss.
 In order to help illustrate how the tax works it is useful to take a simple example. Leicester city reported a pre-tax loss of £34 million in 2012–13. If the club managed to reduce its pre-tax losses to £15 million in 2013–14 then, given its promotion, it would be subject to the tax. If we also assume that the owners are willing and able to invest £5 million of their own money into the club then the rate of tax the team would have to pay is based on the size of its losses over £8 million in the following way:
1% on losses between £8,000,001 and £8,100,000
20% on losses between £8,100,001 and £8,500,000
40% on losses between £8,500,001 and £9,000,000
60% on losses between £9,000,001 and £13,000,000
80% on losses between £13,000,001 and £18,000,000
100% on any losses over £18,000,000
Therefore with a loss of £15 million the FFP tax that Leicester would have to pay is £4,281,000 (£1,000 + £80,000 + £200,000 + £2.4million + £1.6million). If the club instead made a pre-tax financial loss of £30,000 in the 2013–14 season, then the FFP tax it would have to pay increases to £18,681,000 (£1,000 + £80,000 + £200,000 + £2.4million + £4 million + £12 million).
It was originally agreed that the revenue generated from the FFP tax would be shared equally by the teams in the Championship who managed to meet the FFP regulations. However the EPL objected to this provision and the money will now be donated to charity by the EFL.
Based on the financial results reported in 2012–13, about half the clubs in the Championship would be subject to either a transfer ban or FFP tax in January 2015. It was reported in the press in February that a number of clubs had instructed the solicitors, Brabners, to write to the EFL threatening legal action.
One particular concern was the ability of the clubs in the Championship subject to FFP rules to compete with teams relegated from the EPL. When the original FFP regulations were agreed, the teams relegated from the EPL received parachute payments of £48 million over a 4-year period. Following the record-breaking TV deal to broadcast EPL games, the payments were increased to £59 million for the 2013–14 season.
Following the meeting on Tuesday 8th April a spokesman from the EFL said
Considerable progress was achieved on potential improvements to the current regulations following a constructive debate between the clubs.
It will be interesting to see what changes are finally agreed and the implications they will have for the competitive balance of the league.
Articles
Why Championship clubs are crying foul over financial fair play The Guardian (26/2/14)
Wage bills result in big losses at Leicester City and Nottingham Forest The Guardian (5/3/14)
Financial fair play: Championship clubs make progress on talks BBC Sport (10/4/14)
Financial Fair Play in the Football League The Football League (25/4/12)
Loss leaders – Financial Fair Play Rules When Saturday Comes (25/4/12)
Richard Scudamore: financial fair play rules unsustainable in present form The Guardian (14/3/14)
Questions
- To what extent do you think that the implementation of the FFP regulations will either increase or decrease the competitive balance of the Championship?
- An article in the magazine ‘When Saturday Comes’ made the following statement “Last season’s champions, QPR, lost £25.4m and would have been handed a ‘tax’ of at least £17.4m based on 2013-14 thresholds”. Explain why this statement is not accurate. What mistake has the author made when trying to calculate the level of FFP tax payable?
- Nottingham Forest reported pre-tax financial losses of £17 million in 2012-13. If they made the same losses in 2013-14 and were promoted to the EPL, calculate how much FFP tax they would have to pay under current regulations.
- To what extent do you think that the money generated by the FFP tax should be equally distributed between the teams in the Championship who meet the FFP regulations.
- Why do you think team owners might need regulations to restrict the level of losses that they can make. Why might sport be different from other sectors?


 Life expectancy is increasing across the world and the latest set of figures from the Office for National Statistics show that in the UK it has passed 79 for boys born in 2010–12, and 82 for girls born then. In fact the prediction is that over a third of babies born in 2013 will live to more than 100. The data throws up some interesting questions. How well prepared are we for lives that last this long? And how evenly distributed is this increase in life expectancy? Pensions’ minister, Steve Webb, has called for better information on life expectancy to be shared. How would this impact on our decision making?
 But while we can look forward to longer life, for the government, it presents some challenges The first is that we just don’t save enough for our old age. This seems to be partly because we find it hard to make decisions that will have an impact so far in the future. There are a number of measures that have been put in place to encourage us to save more, including auto-enrolment into company pension schemes. This is being rolled out across businesses over the next three years. In the 2014 Budget, the Chancellor announced that people reaching retirement age will be able to draw all their pension as a cash lump sum, rather than having to take it as a regular income.
