On my commute to work on the 6th May, I happened to listen to a programme on BBC radio 4, which provided some fascinating discussion on a variety of economic issues. Technological change is constant and unstoppable and the consequences of it are likely to be both good and bad.
In this programme some top economists, including Joseph Stiglitz offer their analysis of the impact of technology and how the future might look, by considering a range of factors, such as youth unemployment, the productivity of labour, education, pensions and inequality. The benefits of new technology can be seen as endless, but the impact on inequality and how the benefits of technology are being distributed is a concern for many people. The best introduction to the programme and its content is simply to reproduce the description provided by BBC radio 4.
The baby boom generation came of age when it was accepted knowledge that innovation and productivity would always lead to higher standards of living. The generations which followed assumed this truth would continue into the future indefinitely. With the crash of 2008 the upward mobility the middle classes assumed was their right evaporated, and it is unlikely to return.
Martin Wolf, chief economics commentator of the Financial Times, asks how the work force of the future will be changed by the advancements of technologies. How should governments respond to a jobs market which is hollowing out opportunities for traditional educated professions and how will rewards for innovation and income for labour be distributed without creating a society plagued by endemic inequality?
We will speak with optimists and pessimists on both sides of the argument to find out how the repercussions of these changes will affect the way we all live now and well into the future.
It is well worth listening to and provides some interesting insights as to what the future might look like, as the inevitable technological change continues. The link for the programme is below.
 The future is not what it used to be BBC Radio 4 (6/5/14)
Questions
- What are the expected costs and benefits of technological change?
- Which factors are discussed as being the main obstacles to upwards mobility? Why have these become more prevalent in recent decades?
- Using a diagram, explain how technology can improve economic growth. To what extent is the multiplier effect important here?
- How is technology expected to affect the labour market? Use a diagram to help your explanation and make sure you consider both sides of the argument.
- What is meant by the idea that the benefits of new technology are likely to be felt in the long run?
- How important is education in creating equal opportunities?
- What is meant by secular stagnation? Is it seen as being a problem?
 When you think about John Lewis, you think of a large department store. It is a department store celebrating its 150th anniversary. Many large retailers, such as John Lewis, have expanded their product range throughout their history and have grown organically, moving into larger and more prominent locations. What’s the latest location? St Pancras station.
The idea of a click-and-collect store has grown in popularity over the past decade. With more and more people working and leading very busy lives, together with the growth of online shopping, it is the convenience of this type of purchase which has led to many retailers developing click-and-collect. Indeed, for John Lewis, 33% of its internet sales do come through click-and-collect. However, John Lewis is going a step further and its new strategy is reminiscent of companies like Tesco. If you just need to pop into Tesco to get some milk, you’re likely to go to the local Tesco express. The first mover advantage of Tesco in this market was vital.

John Lewis is unusual in that it is owned by its employees and this ownership structure has proved successful. Despite a long history, John Lewis has moved with the times and this latest strategy is further evidence of that. In today’s world, convenience is everything and that is one of the key reasons behind its new St Pancras convenience store. It will allow customers to purchase items and then collect them on their way to and from work – click-and-commute, but it will also provide customers with an easily accessible place to buy electronic equipment and a range of household goods. The retail director, Andrew Murphy said:
In the battleground of convenience, we are announcing a new way for commuters to shop with us … Customers spend a huge amount of time commuting, and our research shows that making life easier and shopping more convenient is their top priority.
This appears to be the first of many smaller convenience stores, enabling John Lewis to gain a presence in seemingly impossible places, given the normal size of such Department stores. For many people, commuting to and from work often involves waiting at transport hubs – one of the big downsides to not driving. So it seems sensible for such an established retailer to take advantage of commuters waiting for their train or plane to arrive, who have time to kill. The following articles consider this new direction for an old retailer.
John Lewis to open St Pancras convenience store BBC News (2/5/14)
John Lewis thinks small with convenience store The Guardian, Zoe Wood (2/5/14)
John Lewis to trial convenience store click-and-collect format at St Pancras Retail Week, Ben Cooper (2/5/14)
Why is click and collect proving so popular? BBC News, Phil Dorrell (2/5/14)
The rise of click and collect for online shoppers BBC News, Phil Dorrell (2/5/14)
Questions
- What are the advantages and disadvantages of the organisational and ownership structure of John Lewis?
- How would you classify this new strategy?
- How do you think this new strategy will benefit John Lewis in terms of its market share, revenue and profit?
- Is it likely that John Lewis will be able to target new customers with this new convenience store strategy?
- How important is a first-mover advantage when it comes to retail? Using game theory, can you create a game whereby there is clear first mover advantage to John Lewis?
 When Kraft took over Cadbury, it was seen as a large take-over, but its size pales in comparison to the potential takeover of AstraZeneca by Pfizer. However, having made two offers for the UK drugs firm, the US company has been rejected twice, saying the terms of the offer were ‘inadequate, substantially undervalue AstraZeneca and are not a basis on which to engage with Pfizer.’
Pfizer initially made an offer of £46.61 per share, valuing the company at £58.5bn, but this latest offer increased the share price to around £50 and raised the company value to £63bn. The rejection was relatively swift and the price still too low, though analysts are suggesting that a price closer to £53 may tempt shareholders. At the moment the negotiations between these two giants remain ‘friendly’, but with this second offer being rejected by the Board, there are now concerns that the takeover could become ‘hostile’ with Pfizer going directly to shareholders. Indeed one investor has said:
We were very keen that the two boards actually get around the table and disucss the bid … I’m never very keen when companies just dismiss things and don’t allow shareholders to take a decision on it … The key thing is that these businesses get talking to each other so they can hammer out a deal.
Following the second offer, shares in AstraZeneca rose by 10p, as the debate continued as to whether such a take-over would be good or bad for British jobs.
Cadbury was seen as a jewel in the crown of British industry and the same can be said of AstraZeneca, especially with the growing importance placed on the Science sector in the UK. While Pfizer has now given the British government further assurances about protection for Britain’s science base, there are still concerns about what this take-over would mean for British jobs. Pfizer has said that 20% of the company’s workforce in research and development would work in the UK and the planned R&D base in Cambridge would still go ahead. However, asset-stripping is a phrase that has been thrown around, based on Pfizer’s previous take-overs and, based on this history, many are suggesting that any assurances made by Pfizer will be pointless. In particular, Allan Black from the GMB union said:
Similar undertakings were given by US multinationals before which have proved to be worthless.
This was echoed by Lord Sainsbury who commented that any assurances made by Pfizer would be ‘frankly meaningless’. However, Vince Cable seems more confident about the consequences for British industry and said:
We’ve now received some assurances from the company that they will strengthen the British science base, they will protect British manufacturing … We need to look at that in detail, we need to look at the small print, we need to establish that it is binding, but as far as it goes, on the basis of what we’ve seen so far, it is welcome and encouraging.
We therefore seem to have a tale of two stories. On the one hand, the assurances of a US company that British jobs and its science base will be protected, but on the other hand, suggestions that we should take Pfizer’s assurances with a pinch of salt and that any take-over could be ‘devastating’. The truth of the matter will only be known if and when the take-over goes ahead and perhaps more importantly, whether it remains friendly and co-operative or does indeed go ‘hostile’. The following articles consider this medical take-over between giants.
AstraZeneca rejects Pfizer bid as US Pharma giant courts UK government The Guardian, Julia Kollewe and Sean Farrell (2/5/14)
AstraZeneca rejects new Pfizer offer BBC News (2/5/14)
AstraZeneca Pfizer: major shareholder urges talks The Telegraph, Denise Roland (2/5/14)
AstraZeneca rejects Pfizer’s raised bid of 63 billion pounds Reuters (2/5/14)
Pfizer-AstraZeneca offer: IoD warns intervention ‘disastrous’ for Britain. The Telegraph, Louise Armitstead (2/5/14)
Pfizer enters takeover discussions with AstraZeneca, sources say Wall Street Journal (2/5/14)
Exclusive: Pfizer insider warns that takeover of AstraZeneca could be ‘devastating’ Independent, Jim Armitage and Chris Green (2/5/14)
The Cadbury deal: how it changed takeovers BBC News, Ben Morris (2/5/14)
Pfizer set to make higher bid for AstraZeneca The Guardian, Julia Kollewe (1/5/14)
The UK’s response to Pfizer’s takeover bid is incoherent and misguided The Guardian, Larry Elliott (4/5/14)
Questions
- What type of take-over would this be classified as? Explain your answer.
- What would occur if the take-over became ‘hostile’?
- Using a demand and supply diagram, explain why share prices in AstraZeneca went up by 10p on the day the second offer was made.
- How would such a take-over affect British jobs?
- Explain how this proposed take-over could (a) boost British R&D in science and (b) harm British R&D in science.
- To what extent might there be concerns from the competition authorities were this take-over to go ahead? How might such a takeover affect Pfizer’s market share and hence its ability to charge a high price?
 Last month the Swiss air freight company Kuehne + Nagel International AG was fined just over NZ$3m (around £1.5m) by the New Zealand Commerce Commission for their part in a price fixing cartel that ran for 5 years.
In 2002 the firms in the industry faced higher costs due to increased security measures imposed by the British government. They formed a cartel to agree to pass these increased costs on to their customers for air freight services from the UK to a number of countries, including New Zealand. The investigation by the New Zealand competition authority followed a leniency application by one of the participants in 2007. Five other participants had previously been fined, but Kuehne + Nagel decided to fight the case. The fine imposed on them brought the total fines to almost NZ$12m (around £6m).
 A previous post on this site highlighted how golf played a prominent role in several previous cartels. However, this cartel seemed to have had a fixation on gardening and referred to the cartel as the gardening club. Other parties involved in the cartel were referred to as fellow gardeners and the agreed upon price as the price for asparagus! When a participant suspected a rival may have cheated on the cartel agreement email exchanges such as this one took place:
I hear… concerns about the price of produce from the garden of Velcro, which appears to be operating as a charitable cooperative for the benevolence of vegetable eaters rather than growers…
It is not known whether the Kuehne + Nagel employees involved in the cartel were placed on gardening leave during the investigation!
‘Gardening Club’ hid hardcore air freight cartel New Zealand Herald, Hamish Fletcher (04/04/14)
‘Gardening Club’ Air Freight Forwarding Cartel Finally Buried by High Court Handy Shipping Guide (08/04/14)
Swiss firm fined $3.1 million over cartel 3 News (08/04/14)
‘Gardening Club’ freight cartel participant, Kuehne + Nagel, fined $3.1m The National Business Review (08/04/14)
Questions
- Why is an increase in costs likely to trigger price fixing behaviour?
- Why might the members want to use code names to run a cartel’s activities?
- Why do competition authorities grant leniency to cartel members that inform them about price fixing behaviour?
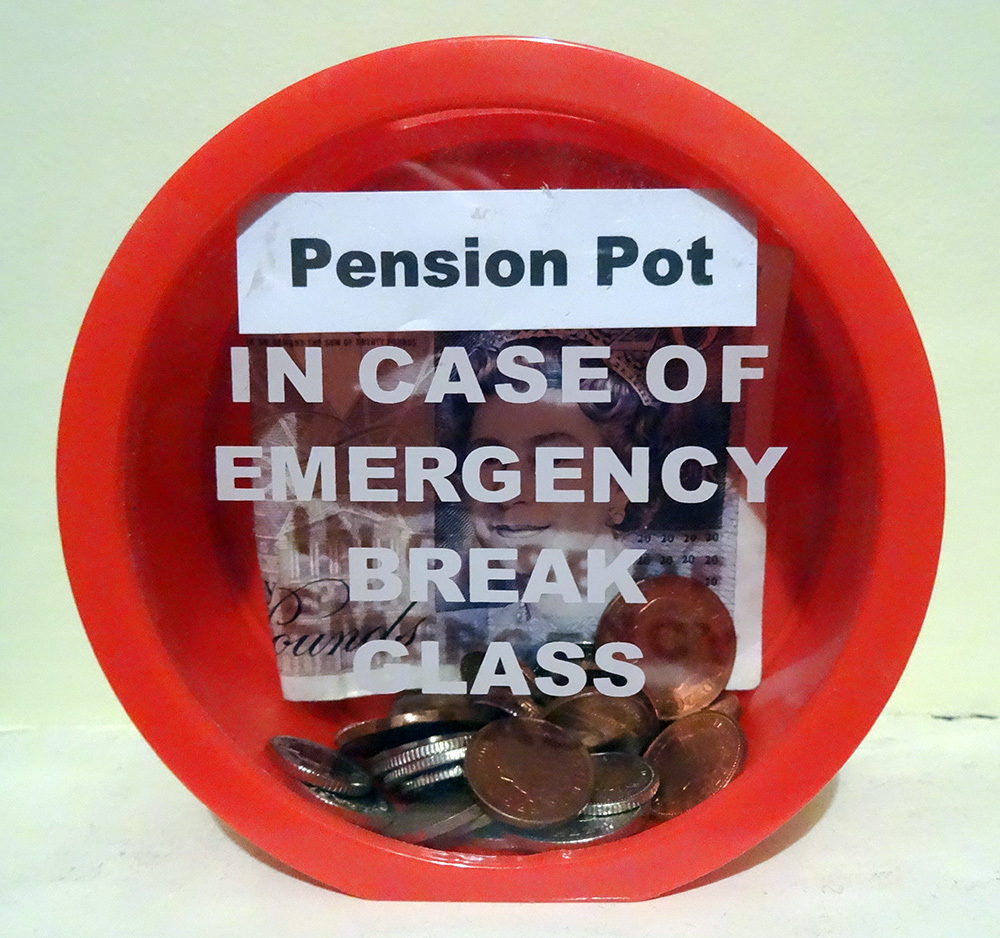
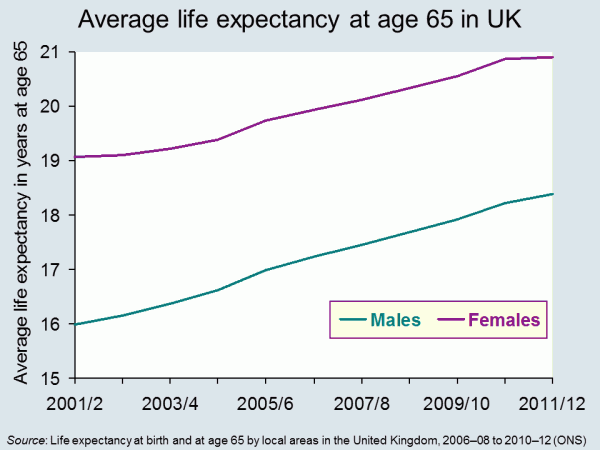 Life expectancy is increasing across the world and the latest set of figures from the Office for National Statistics show that in the UK it has passed 79 for boys born in 2010–12, and 82 for girls born then. In fact the prediction is that over a third of babies born in 2013 will live to more than 100. The data throws up some interesting questions. How well prepared are we for lives that last this long? And how evenly distributed is this increase in life expectancy? Pensions’ minister, Steve Webb, has called for better information on life expectancy to be shared. How would this impact on our decision making?
It seems reasonable to think that increasing life expectancy must be good news. And of course, for individuals it can be. In 1951 the average man retiring at 65, in England and Wales, could expect to live and draw a pension for another 12.1 years. By 2014 this had risen to 22 years.
 But while we can look forward to longer life, for the government, it presents some challenges The first is that we just don’t save enough for our old age. This seems to be partly because we find it hard to make decisions that will have an impact so far in the future. There are a number of measures that have been put in place to encourage us to save more, including auto-enrolment into company pension schemes. This is being rolled out across businesses over the next three years. In the 2014 Budget, the Chancellor announced that people reaching retirement age will be able to draw all their pension as a cash lump sum, rather than having to take it as a regular income.
Another concern for government is the variations that we find in life expectancy across the UK. The 2014 ONS data identified that life expectancy for men born in Glasgow in 2012 is 72.6, in East Dorset it is 82.9. 25% of those in Glasgow are not expected to live to 65. The gap in years of good health is even greater. This presents governments with a long-term problem. How do they achieve greater equality in this instance? Do they focus resources on the areas that need it most? Do they legislate to address behaviour? Or do they rely on the provision of good advice – on diet, exercise and other factors?
Information has a role to play in both areas identified above. In April 2014, Steve Webb, suggested that in order to make good decisions at the point of retirement, people need to understand more about what lies ahead. He said:
People tend to underestimate how long they’re likely to live, so we’re talking about averages, something very broad-brush. Based on your gender, based on your age, perhaps asking one or two basic questions, like whether you’ve smoked or not, you can tell somebody that they might, on average, live for another 20 years or so.
This suggestion has led to some concerns being expressed at what appears to be an over-simplistic approach. Estimates can only be based on a mix of averages modified by individual information. Would the projections be shared with pension providers? What would you do if you exceeded your forecast life expectancy – by a long way – and had spent all your money? Could you sue someone?
Will your pension pot last as long as you will? The Telegraph, Dan Hyde and Richard Dyson (23/4/2014)
Scientists invent death test that will tell us how long we have to live Metro (11/8/13)
Games host Glasgow has worst life expectancy in the UK The Guardian, Caroline Davies (16/4/2014)
Pensioners could get life expectancy guidance BBC News Politics (17/4/14)
ONS reveals gaps in life expectancy across the UK FT Adviser Pensions, Kevin White (23/4/14)
Health care aid for developing countries boosts life expectancy Health Canal, Ruth Ann Richter (22/4/14)
A third of babies born this year will live to 100 This is Money.co.uk, Adam Uren (11/12/13)
Questions
- Thinking about the UK, what are the factors that might explain variations in life expectancy across different regions? How might the government address these differences? Why would they want to do so?
- Do the same factors explain variations between countries? Who can address these differences? Who would want to do so?
- If you could have a reasonable prediction of your life expectancy at 65, would you want it? How would your behaviour change if you were predicted a longer than average life expectancy? How would it change if you were predicted a shorter than average life expectancy?
- If you could have an accurate prediction of your life expectancy at 18, how would your answers differ? If this were possible, would it present any problems?