I admit it, the title of my blog today is a little bit misleading – but at the same time very appropriate for today’s topic. Nancy Sinatra certainly wasn’t thinking about emigration when she was singing this song – it had nothing to do with it, after all. It is, however, very relevant to economists: Indeed, there are many economics papers discussing the effects of skilled immigration on host and source economies and regions.
Economists often use the term ‘brain drain’ to describe the migration of highly skilled workers from poor/developing to rich/developed economies. Such flows are anything but unusual. As The Economist points out in a recent article, ‘[I]n the decade to 2010–11 the number of university-educated migrants in the G20, a group of large economies that hosts two-thirds of the world’s migrants, grew by 60% to 32m according to the OECD, a club of mostly rich countries.’.
The effects of international migration are found to be overwhelmingly positive for both skilled migrant workers and their hosts. This is particularly true for highly skilled workers (such as academics, physicians and other professionals), who, through emigration, get the opportunity to earn a significantly higher return on their skills that what they might have had in their home country. Very often their home country is saturated and oversupplied with skilled workers competing for a very limited number of jobs. Also, they get the opportunity to practise their profession – which they might not have had otherwise.
But what about their home countries? Are they worse off for such emigration?
There are different views when it comes to answering this question. One argument is that the prospect of international migration incentivises people in developing countries to accumulate skills (brain gain) – which they might not choose to do otherwise, if the expected return to skills was not high enough to warrant the effort and opportunity cost that comes with it. Beine et al (2011) find that:
Our empirical analysis predicts conditional convergence of human capital indicators. Our findings also reveal that skilled migration prospects foster human capital accumulation in low-income countries. In these countries, a net brain gain can be obtained if the skilled emigration rate is not too large (i.e. it does not exceed 20–30% depending on other country characteristics). In contrast, we find no evidence of a significant incentive mechanism in middle-income, and not surprisingly, high-income countries.
Other researchers find that emigration can have a significant negative effect on source economies (countries or regions) – especially if it affects a large share of the local workforce within a short time period. Ha et al (2016), analyse the effect of emigration on human capital formation and economic growth of Chinese provinces:
First, we find that permanent emigration is conducive to the improvement of both middle and high school enrollment. In contrast, while temporary emigration has a significantly positive effect on middle school enrollment it does not affect high school enrollment. Moreover, the different educational attainments of temporary emigrants have different effects on school enrollment. Specifically, the proportion of temporary emigrants with high school education positively affects middle school enrollment, while the proportion of temporary emigrants with middle school education negatively affects high school enrollment. Finally, we find that both permanent and temporary emigration has a detrimental effect on the economic growth of source regions.
So yes or no? Good or bad? As everything else in economics, the answer quite often is ‘it depends’.
World Development, Michel Beine, Ric Docquier and Cecily Oden-Defoort (Vol 39, No 4, pp 523–532, 2011)
Questions
‘The brain drain makes a bad situation worse, by stripping developing economies of their most valuable assets: skilled workers’. Discuss.
Using Google, find data on the inflows and outflows of skilled labour for a developing country of your choice. Explain your results.
‘Brain drain’ or ‘brain gain’? What is your personal view on this debate? Explain your opinion by using anecdotal evidence, personal experience and examples.
Referring to the previous question, write a critique of your answer.
The IMF has just published its six-monthly World Economic Outlook. This provides an assessment of trends in the global economy and gives forecasts for a range of macroeconomic indicators by country, by groups of countries and for the whole world.
This latest report is upbeat for the short term. Global economic growth is expected to be around 3.9% this year and next. This represents 2.3% this year and 2.5% next for advanced countries and 4.8% this year and 4.9% next for emerging and developing countries. For large advanced countries such rates are above potential economic growth rates of around 1.6% and thus represent a rise in the positive output gap or fall in the negative one.
But while the near future for economic growth seems positive, the IMF is less optimistic beyond that for advanced countries, where growth rates are forecast to decline to 2.2% in 2019, 1.7% in 2020 and 1.5% by 2023. Emerging and developing countries, however, are expected to see growth rates of around 5% being maintained.
For most countries, current favorable growth rates will not last. Policymakers should seize this opportunity to bolster growth, make it more durable, and equip their governments better to counter the next downturn.
By comparison with other countries, the UK’s growth prospects look poor. The IMF forecasts that its growth rate will slow from 1.8% in 2017 to 1.6% in 2018 and 1.5% in 2019, eventually rising to around 1.6% by 2023. The short-term figures are lower than in the USA, France and Germany and reflect ‘the anticipated higher barriers to trade and lower foreign direct investment following Brexit’.
The report sounds some alarm bells for the global economy.
The first is a possible growth in trade barriers as a trade war looms between the USA and China and as Russia faces growing trade sanctions. As Christine Lagarde, managing director of the IMF told an audience in Hong Kong:
Governments need to steer clear of protectionism in all its forms. …Remember: the multilateral trade system has transformed our world over the past generation. It helped reduce by half the proportion of the global population living in extreme poverty. It has reduced the cost of living, and has created millions of new jobs with higher wages. …But that system of rules and shared responsibility is now in danger of being torn apart. This would be an inexcusable, collective policy failure. So let us redouble our efforts to reduce trade barriers and resolve disagreements without using exceptional measures.
The second danger is a growth in world government and private debt levels, which at 225% of global GDP are now higher than before the financial crisis of 2007–9. With Trump’s policies of tax cuts and increased government expenditure, the resulting rise in US government debt levels could see some fiscal tightening ahead, which could act as a brake on the world economy. As Maurice Obstfeld , Economic Counsellor and Director of the Research Department, said at the Press Conference launching the latest World Economic Outlook:
Debts throughout the world are very high, and a lot of debts are denominated in dollars. And if dollar funding costs rise, this could be a strain on countries’ sovereign financial institutions.
In China, there has been a massive rise in corporate debt, which may become unsustainable if the Chinese economy slows. Other countries too have seen a surge in private-sector debt. If optimism is replaced by pessimism, there could be a ‘Minsky moment’, where people start to claw down on debt and banks become less generous in lending. This could lead to another crisis and a global recession. A trigger could be rising interest rates, with people finding it hard to service their debts and so cut down on spending.
The third danger is the slow growth in labour productivity combined with aging populations in developed countries. This acts as a brake on growth. The rise in AI and robotics (see the post Rage against the machine) could help to increase potential growth rates, but this could cost jobs in the short term and the benefits could be very unevenly distributed.
This brings us to a final issue and this is the long-term trend to greater inequality, especially in developed economies. Growth has been skewed to the top end of the income distribution. As the April 2017 WEO reported, “technological advances have contributed the most to the recent rise in inequality, but increased financial globalization – and foreign direct investment in particular – has also played a role.”
And the policy of quantitative easing has also tended to benefit the rich, as its main effect has been to push up asset prices, such as share and house prices. Although this has indirectly stimulated the economy, it has mainly benefited asset owners, many of whom have seen their wealth soar. People further down the income scale have seen little or no growth in their real incomes since the financial crisis.
For what reasons may the IMF forecasts turn out to be incorrect?
Why are emerging and developing countries likely to experience faster rates of economic growth than advanced countries?
What are meant by a ‘positive output gap’ and a ‘negative output gap’? What are the consequences of each for various macroeconomic indicators?
Explain what is meant by a ‘Minsky moment’. When are such moments likely to occur? Explain why or why not such a moment is likely to occur in the next two or three years?
For every debt owed, someone is owed that debt. So does it matter if global public and/or private debts rise? Explain.
What have been the positive and negative effects of the policy of quantitative easing?
What are the arguments for and against using tariffs and other forms of trade restrictions as a means of boosting a country’s domestic economy?
The last two weeks have been quite busy for macroeconomists, HM Treasury staff and statisticians in the UK. The Chancellor of the Exchequer, Mr Phillip Hammond, delivered his (fairly upbeat) Spring Budget Statement on 13 March, highlighting among other things the ‘stellar performance’ of UK labour markets. According to a Treasury Press Release:
Employment has increased by 3 million since 2010, which is the equivalent of 1,000 people finding work every day. The unemployment rate is close to a 40-year low. There is also a joint record number of women in work – 15.1 million. The OBR predict there will be over 500,000 more people in work by 2022.
To put these figures in perspective, according to recent ONS estimates, in January 2018 the rate of UK unemployment was 4.3 per cent – down from 4.4 per cent in December 2017. This is the lowest it has been since 1975. This is of course good news: a thriving labour market is a prerequisite for a healthy economy and a good sign that the UK is on track to full recovery from its 2008 woes.
The Bank of England welcomed the news with a mixture of optimism and relief, and signalled that the time for the next interest rate hike is nigh: most likely at the next MPC meeting in May.
But what is the practical implication of all this for UK consumers and workers?
For workers it means it’s a ‘sellers’ market’: as more people get into employment, it becomes increasingly difficult for certain sectors to fill new vacancies. This is pushing nominal wages up. Indeed, UK wages increased on average by 2.6 per cent year-to-year.
In real terms, however, wage growth has not been high enough to outpace inflation: real wages have fallen by 0.2 per cent compared to last year. Britain has received a pay rise, but not high enough to compensate for rising prices. To quote Matt Hughes, a senior ONS statistician:
Employment and unemployment levels were both up on the quarter, with the employment rate returning to its joint highest ever. ‘Economically inactive’ people — those who are neither working nor looking for a job — fell by their largest amount in almost five and a half years, however. Total earnings growth continues to nudge upwards in cash terms. However, earnings are still failing to outpace inflation.
An increase in interest rates is likely to put further pressure on indebted households. Even more so as it coincides with the end of the five-year grace period since the launch of the 2013 Help-to-Buy scheme, which means that many new homeowners who come to the end of their five year fixed rate deals, will soon find themselves paying more for their mortgage, while also starting to pay interest on their Help-to-buy government loan.
Will wages grow fast enough in 2018 to outpace inflation (and despite Brexit, which is now only 12 months away)? We shall see.
Would you start a family if you were pessimistic about the future of the economy? Buckles et al (2017) (see link below) believe that fewer of us would do so and, therefore, fertility rates could be used by investors and central banks as an early signal to pick up subtle changes in consumer confidence and overall economic climate.
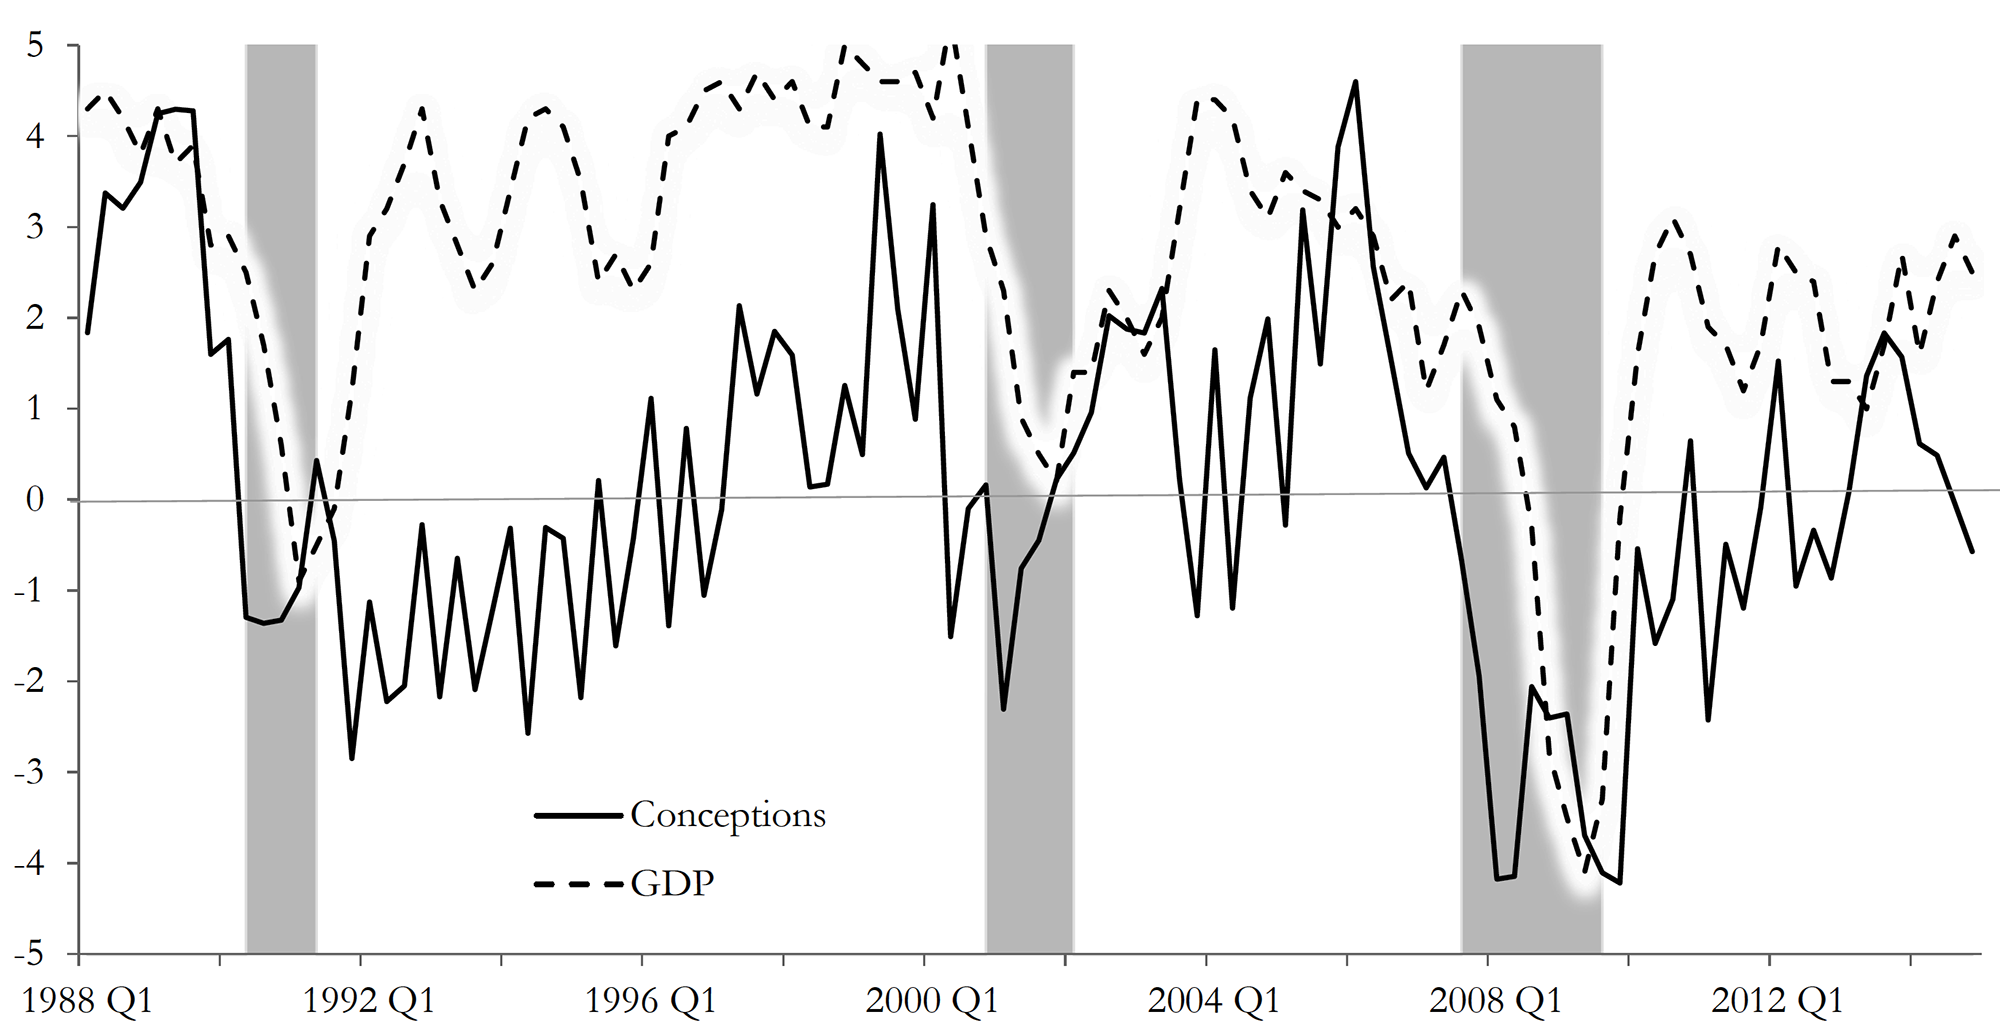
Their study titled ‘Fertility is a leading economic indicator’ uses ‘live births’ data, sourced from US birth certificates, to explore if there is any association between fertility changes (measured as the rate of change in number of births) and GDP growth. Their results suggest that, in the case of the USA, there is: dips in fertility rates tend to precede by several quarters slowdown in economic activity. As the authors state:
The growth rate of conceptions declines prior to economic downturns and the decline occurs several quarters before recessions begin. Our measure of conceptions is constructed using live births; we present evidence suggesting that our results are indeed driven by changes in conceptions and not by changes in abortion or miscarriage. Conceptions compare well with or even outperform other economic indicators in anticipating recessions.
Conception and GDP Growth Rates (source Buckles et al p33: see below)
Although this is not the first piece of academic writing to claim that fertility has pro-cyclical qualities (see for instance, Adsera (2004, 2011), Adsera and Menendez (2011), Currie and Schwandt (2014) and Chatterjee and Vogle (2016) linked below), it is, to the best of our knowledge, the most recent paper (in terms of data used) to depict this relationship and to explore the suitability of fertility as a macroeconomic indicator to predict recessions.
Economies, after all, are groups of people who participate actively in day-to-day production and consumption activities – as consumers, workers and business leaders. Changes in their environment should affect their expectations about the future.
Are people, however, forward-looking enough to guide their current behaviours by their expectations of future economic outcomes? They may be, according to the findings of this study.
Did you know, for instance, that sales of ties tend to increase in economic downturns, as men buy more ties to show that they are working harder, in fear of losing their job[1]? But this is probably a topic for another blog.
Give two reasons why fertility rates may be a good indicator of economic activity.
Give two reasons why fertility rates may NOT be a good indicator of economic activity.
Do a literature search to identify and explain an ‘unorthodox’ macroeconomic indicator of your choice, and how it has been used to track economic activity.
The Winter Olympics are full on as athletes from all over the world compete against each other, hoping to set new world records, win medals and be known as Olympians. Pyeongchang, the South Korean county that hosts the 2018 Winter games, enjoys a large influx of tourists – estimated at 80,000 people a day. This is certainly an unusually large number of tourists for a region that has a regular winter-time population of no more than 45,000 people.
Having such a high number of visitors to the Winter Olympics, and even more to the larger Summer Olympics, is not an unusual occurrence, however, and it is often mentioned as one of the benefits of being a host to the Olympic Games.
Baade and Matheson (see link below) distinguish between three key benefits of hosting the Olympic Games: “the short-run benefits of tourist spending during the Games; the long-run benefits or the ‘Olympic legacy’, which might include improvements in infrastructure and increased trade, foreign investment, or tourism after the Games; and intangible benefits such as the ‘feel-good effect’ or civic pride”.
On these grounds, a number of studies have been authored, attempting to analyse some or all of these benefits, distinguishing between short-term and long-term effects. Müller (see link below), uses data from the 2014 Oympic Games in Sochi, Russia, to assess the net economic outcome for the host region. He concludes that any short-term economic benefits caused by the investment influx (before and during the games) could not offset the long-term costs, leading to an estimated net loss of $1.2 billion per year.
Zimbalist (2015) and Szymanski (2011) report similar results when analysing data from the London Games (2012) and past major sporting events (Games and FIFA World Cup). Kasimati (2003) points out the significant economic benefits that host regions tend to enjoy for years after hosting the games, but argues that the overall effect depends on a number of factors (including pre-existing infrastructure and location).
The jury is, therefore, still out on what is the overall economic effect of being host to this ancient institution. But I must now dash as women’s hockey is soon to start. “Let everyone shine”.
Using supply and demand diagrams, explain whether you would expect hotel room prices to change during the hosting of a major sports event, such as the Winter Olympics.
List three economic (or economics-related) arguments in favour of and against the hosting of the Olympic games. Relate your answer to the empirical evidence presented in the literature.
Why is it so difficult to estimate with accuracy the net economic effect of the Olympic Games?
 I admit it, the title of my blog today is a little bit misleading – but at the same time very appropriate for today’s topic. Nancy Sinatra certainly wasn’t thinking about emigration when she was singing this song – it had nothing to do with it, after all. It is, however, very relevant to economists: Indeed, there are many economics papers discussing the effects of skilled immigration on host and source economies and regions.
 But what about their home countries? Are they worse off for such emigration?
 The IMF has just published its six-monthly
  The short-term figures are lower than in the USA, France and Germany and reflect ‘the anticipated higher barriers to trade and lower foreign direct investment following Brexit’.
 The second danger is a growth in
 The last two weeks have been quite busy for macroeconomists, HM Treasury staff and statisticians in the UK. The Chancellor of the Exchequer, Mr Phillip Hammond, delivered his (fairly upbeat) Spring Budget Statement on 13 March, highlighting among other things the ‘stellar performance’ of UK labour markets. According to a