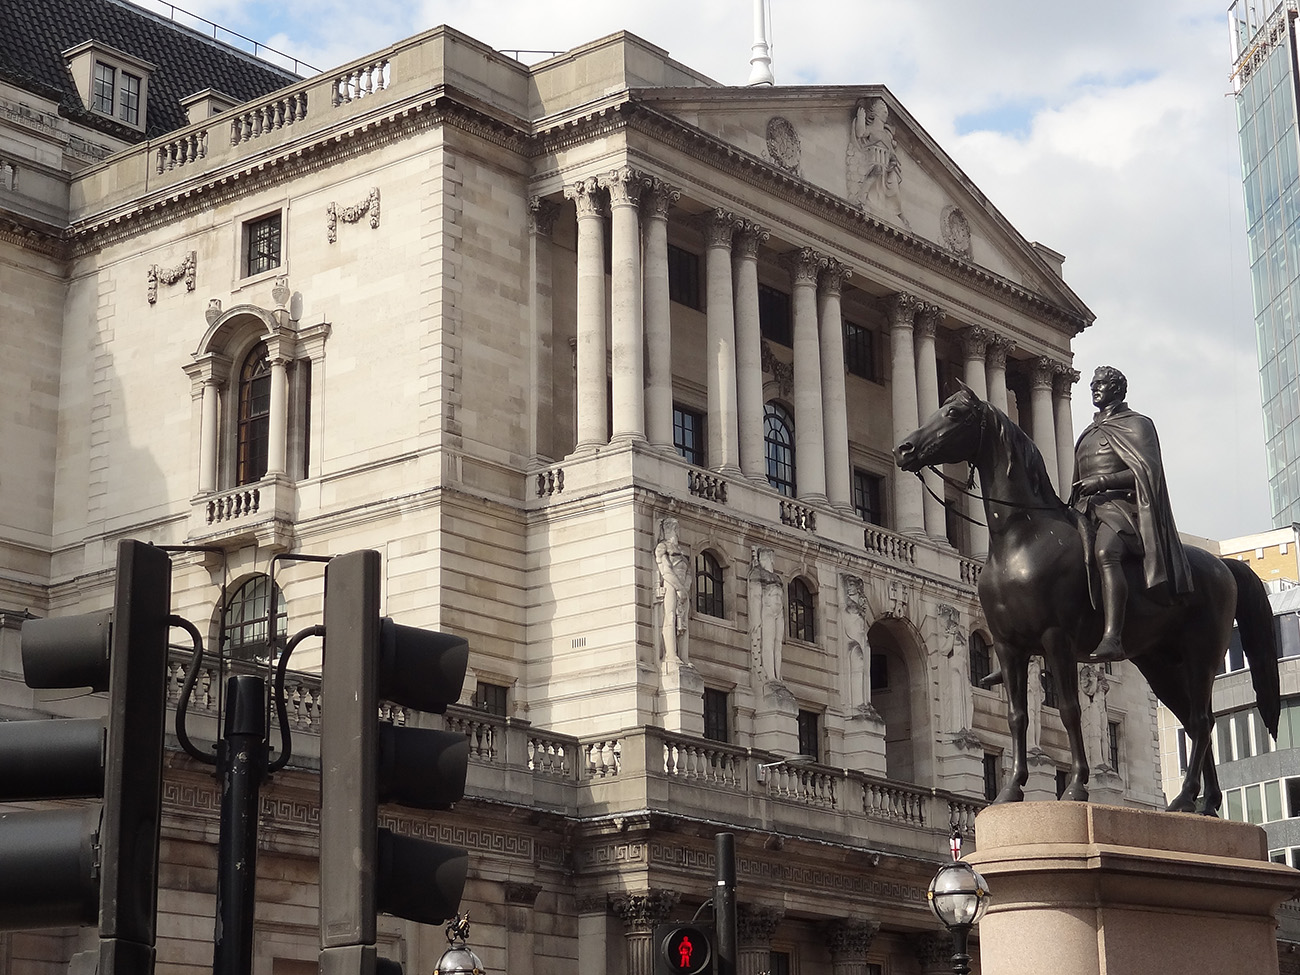
 On 8 February, the Bank of England issued a statement that was seen by many as a warning for earlier and speedier than previously anticipated increases in the UK base rate. Mark Carney, the governor of the Bank of England, referred in his statement to ‘recent forecasts’ which make it more likely that ‘monetary policy would need to be tightened somewhat earlier and by a somewhat greater extent over the forecast period than anticipated at the time of the November report’.
A similar picture emerges on the other side of the Atlantic. With labour markets continuing to deliver spectacularly high rates of employment (the highest in the last 17 years), there are also now signs that wages are on an upward trajectory. According to a recent report from the US Bureau of Labor Statistics, US wage growth has been stronger than expected, with average hourly earnings rising by 2.9 percent – the strongest growth since 2009.
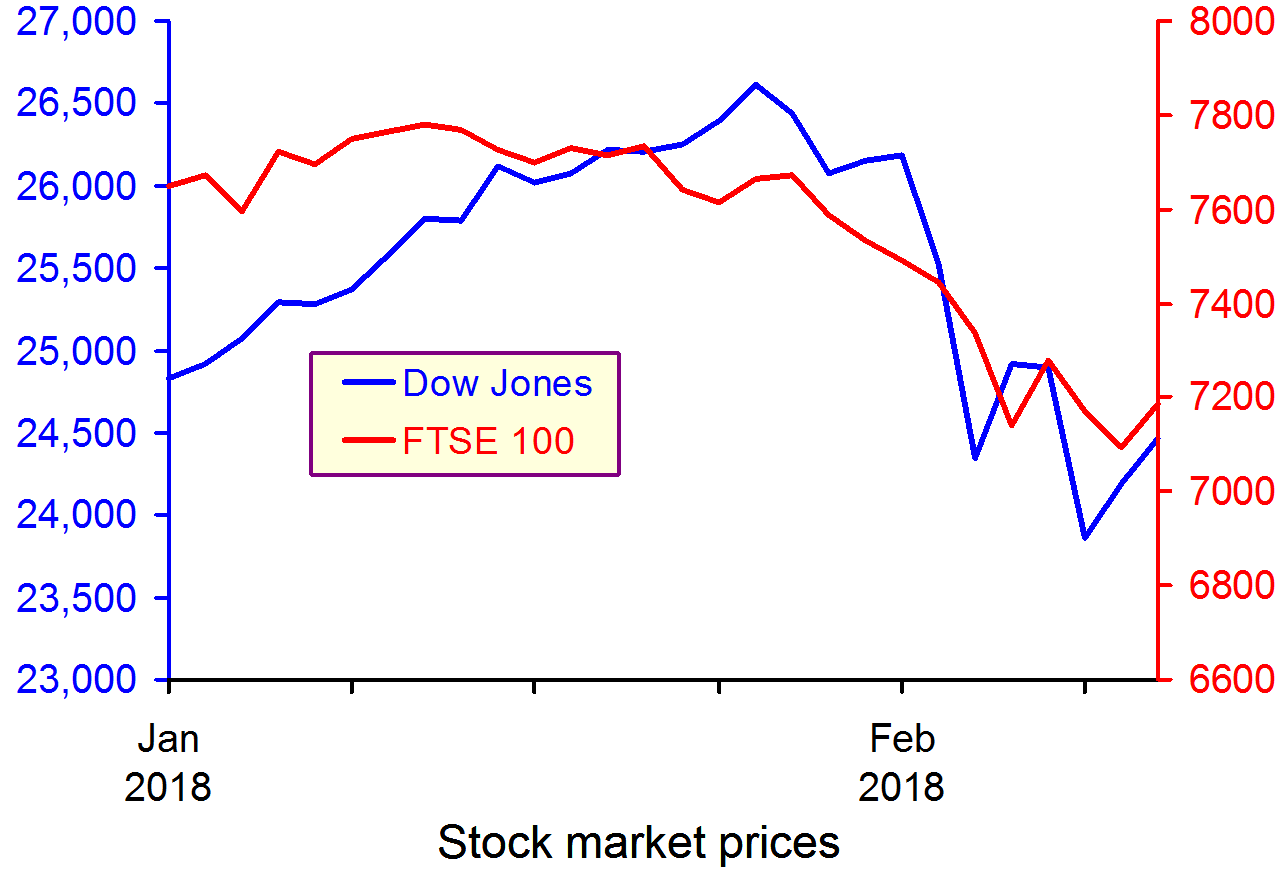
 These statements have coincided with a week of sharp corrections and turbulence in the world’s largest capital markets, as investors become increasingly conscious of the threat of rising inflation – and the possibility of tighter monetary policy.
The Dow Jones plunged from an all-time high of 26,186 points on 1 February to 23,860 a week later – losing more than 10 per cent of its value in just five trading sessions (suffering a 4.62 percentag fall on 5 February alone – the worst one-day point fall since 2011). European and Asian markets followed suit, with the FTSE-100, DAX and NIKKEI all suffering heavy losses in excess of 5 per cent over the same period.
 But why should higher inflationary expectations fuel a sell-off in global capital markets? After all, what firm wouldn’t like to sell its commodities at a higher price? Well, that’s not entirely true. Investors know that further increases in inflation are likely to be met by central banks hiking interest rates. This is because central banks are unlikely to be willing or able to allow inflation rates to rise much above their target levels.
The Bank of England, for instance, sets itself an inflation target of 2%. The actual ongoing rate of inflation reported in the latest quarterly Inflation Report is 3% (50 per cent higher than the target rate).
Any increase in interest rates is likely to have a direct impact on both the demand and the supply side of the economy.
Consumers (the demand side) would see their cost of borrowing increase. This could put pressure on households that have accumulated large amounts of debt since the beginning of the recession and could result in lower consumer spending.
Firms (the supply side) are just as likely to suffer higher borrowing costs, but also higher operational costs due to rising wages – both of which could put pressure on profit margins.
It now seems more likely that we are coming towards the end of the post-2008 era – a period that saw the cost of money being driven down to unprecedentedly low rates as the world’s largest economies dealt with the aftermath of the Great Recession.
For some, this is not all bad news – as it takes us a step closer towards a more historically ‘normal’ equilibrium. It remains to be seen how smooth such a transition will be and to what extent the high-leveraged world economy will manage to keep its current pace, despite the increasingly hawkish stance in monetary policy by the world’s biggest central banks.
Video
 Dow plunges 1,175 – worst point decline in history CNN Money, Matt Egan (5/2/18)
Articles
Global Markets Shed $5.2 Trillion During the Dow’s Stock Market Correction Fortune, Lucinda Shen (9/2/18)
Bank of England warns of larger rises in interest rates Financial Times, Chris Giles and Gemma Tetlow (8/2/18)
Stocks are now in a correction — here’s what that means Business Insider, Andy Kiersz (8/2/18)
US economy adds 200,000 jobs in January and wages rise at fastest pace since recession Business Insider, Akin Oyedele (2/2/18)
Questions
- Using supply and demand diagrams, explain the likely effect of an increase in interest rates to equilibrium prices and output. Is it good news for investors and how do you expect them to react to such hikes? What other factors are likely to influence the direction of the effect?
- Do you believe that the current ultra-low interest rates could stay with us for much longer? Explain your reasoning.
- What is likely to happen to the exchange rate of the pound against the US dollar, if the Bank of England increases interest rates first?
- Why do stock markets often ‘overshoot’ in responding to expected changes in interest rates or other economic variables
 OPEC, for some time, was struggling to control oil prices. Faced with competition from the fracking of shale oil in the USA, from oil sands in Canada and from deep water and conventional production by non-OPEC producers, its market power had diminished. OPEC now accounts for only around 40% of world oil production. How could a ‘cartel’ operate under such conditions?
One solution was attempted in 2014 and 2015. Faced with plunging oil prices which resulted largely from the huge increase in the supply of shale oil, OPEC refused to cut its output and even increased it slightly. The aim was to keep prices low and to drive down investment in alternative sources, especially in shale oil wells, many of which would not be profitable in the long term at such prices.
In late 2016, OPEC changed tack. It introduced its first cut in production since 2008. In September it introduced a new quota for its members that would cut OPEC production by 1.2 million barrels per day. At the time, Brent crude oil price was around $46 per barrel.
In December 2016, it also negotiated an agreement with non-OPEC producers, and most significantly Russia, that they would also cut production, giving a total cut of 1.8 million barrels per day. This amounted to around 2% of global production. In March 2017, it was agreed to extend the cuts for the rest of the year and in November 2017 it was agreed to extend them until the end of 2018.
With stronger global economic growth in 2017 and into 2018 resulting in a growth in demand for oil, and with OPEC and Russia cutting back production, oil prices rose rapidly again (see chart: click here for a PowerPoint). By January 2018, the Brent crude price had risen to around $70 per barrel.

Low oil prices had had the effect of cutting investment in shale oil wells and other sources and reducing production from those existing ones which were now unprofitable. The question being asked today is to what extent oil production from the USA, Canada, the North Sea, etc. will increase now that oil is trading at around $70 per barrel – a price, if sustained, that would make investment in many shale and other sources profitable again, especially as costs of extracting shale oil is falling as fracking technology improves. US production since mid-2016 has already risen by 16% to nearly 10 million barrels per day. Costs are also falling for oil sand and deep water extraction.
In late January 2018, Saudi Arabia claimed that co-operation between oil producers to limit production would continue beyond 2018. Shale oil producers in the USA are likely to be cheered by this news – unless, that is, Saudi Arabia and the other OPEC and non-OPEC countries party to the agreement change their minds.
Videos
OPEC’s Control of the Oil Market Is Running on Fumes Bloomberg (21/12/17)
Oil Reaches $70 a Barrel for First Time in Three Years Bloomberg, Stuart Wallace (11/1/18)
Banks Increasingly Think OPEC Will End Supply Cuts as Oil Hits $70 Bloomberg, Grant Smith (15/1/18)
Articles
Oil prices rise to hit four-year high of $70 a barrel BBC News (11/1/18)
Overshooting? Oil hits highest level in almost three years, with Brent nearing $70 Financial Times, Anjli Raval (10/1/18)
Can The Oil Price Rally Continue? OilPrice, Nick Cunningham (14/1/18)
Will This Cause An Oil Price Reversal? OilPrice, Olgu Okumus (22/1/18)
The world is not awash in oil yet
Arab News, Wael Mahdi (14/1/15)
‘Explosive’ U.S. oil output growth seen outpacing Saudis, Russia CBC News (19/1/18)
Oil’s Big Two seeking smooth exit from cuts The Business Times (23/1/18)
Saudi comments push oil prices higher BusinessDay, Henning Gloystein (22/1/18)
Report
Short-term Energy Outlook U.S. Energy Information Administration (EIA) (9/1/18)
Questions
- Using supply and demand diagrams, illustrate what has happened to oil prices and production over the past five years. What assumptions have you made about the price elasticity of supply and demand in your analysis?
- If the oil price is above the level at which it is profitable to invest in new shale oil wells, would it be in the long-term interests of shale oil companies to make such investments?
- Is the structure of the oil industry likely to result in long-term cycles in oil prices? Explain why or why not.
- Investigate the level of output from, and investment in, shale oil wells over the past three years. Explain what has happened.
- Would it be in the interests of US producers to make an agreement with OPEC on production quotas? What would prevent them from doing so?
- What is likely to happen to oil prices over the coming 12 months? What assumptions have you made and how have they affected your answer?
- If the short-term marginal costs of operating shale oil wells is relatively low (say, below $35 per barrel) but the long-term marginal cost (taking into account the costs of investing in new wells) is relatively high (say, over $65 per barrel) and if the life of a well is, say, 5 years, how is this likely to affect the pattern of prices and output over a ten-year period? What assumptions have you made and how do they affect your answer?
- If oil production from countries not party to the agreement between OPEC and non-OPEC members increases rapidly and if, as a result, oil prices start to fall again, what would it be in OPEC’s best interests to do?
 Each year for the past 60 years, the ONS has published ‘Family Spending’, which ‘gives an insight into the spending habits of UK households, broken down by household characteristics and types of spending’. The latest issue, covering the financial year ending 2017, has just been released.
To mark the 60th anniversary, the ONS has also published a blog, Celebrating 60 years of Family Spending, which compares spending patterns in 2017 with those in 1957. The blog looks at the percentage of the family budget spent on various categories, such as food, clothing, housing, tobacco and alcohol. Some of the percentages have changed dramatically over the years; others have hardly changed at all.
Before you read on, of the six categories mentioned above, which do you think have increased, which fallen and which stayed the same? What is your reasoning?
 Differences in patterns of consumption partly reflect incomes. In 1957, real household income was £381 in today’s prices; today it’s £544 (43% more). You would expect, therefore, that a greater proportion of household incomes today would be spent on more luxurious goods, with a higher income elasticity of demand.
Other changes in consumption patterns reflect changes in tastes and attitudes. Thus there has been a huge fall in the proportion of household income spent on tobacco – down from 6% in 1957 to 1% in 2017.
 Three of the biggest changes over the 60 years have been in housing costs, food and clothing. Housing costs (rent, mortgage interest, council tax, maintenance and home repairs) have doubled from around 9% to around 18% (although they were around 20% before the huge fall in interest rates following the financial crisis of 2007–8). Expenditure on food, by contrast, has fallen – from around 33% to around 16%. Expenditure on clothing has also fallen, from around 10% to around 5%.
Expenditure on alcohol, on the other hand, having risen somewhat in the 1970s and 80s, is roughly the same today as it was 60 years ago, at around 3% of household expenditure.
 Some of the explanations for these changing patterns can be found on the supply side – changing costs of production, new technologies and competition; others can be found on the demand side – changes in tastes and changes in incomes. Some goods and services which we use today, such as computers, mobile phones, many other electrical goods, high-tech gyms and social media were simply not available 60 years ago.
Articles
Celebrating 60 years of Family Spending ONS blog, Joanna Bulman (18/1/18)
How did households budget in 1957? BBC News, Simon Gompertz (18/1/18)
Rising burden of housing costs shown by 60-year UK spending survey Financial Times, Gemma Tetlow (18/1/18)
Data
Family spending in the UK: financial year ending 2017 ONS Statistical Bulletin (18/1/18)
All data related to Family spending in the UK: financial year ending 2017 ONS datasets (18/1/18)
Questions
- Why has expenditure on housing increased so much as a proportion of household expenditure? What underlying factors help to explain this?
- Why has expenditure on food fallen as a proportion of household expenditure? Are the explanations on both the demand and supply sides?
- What has happened to the proportion of expenditure going on leisure goods and services? Explain.
- What factors affect the proportion of expenditure going on motoring?
- Of the broad categories of expenditure considered in this blog, which would you expect to increase, which to decrease and which to stay roughly the same over the coming 10 years? Why?
- If expenditure on a particualar good falls as a percentage of total expenditure as income rises, does this make it an inferior good? Explain.
What do tulips, nickel mining in Australia, South Seas trading, Beanie Babies and cryptocurrencies have in common? The answer is that they have all been the subject of speculative bubbles. In the first four cases the bubble burst. A question currently being asked is whether it will happen to bitcoin.
Bitcoin
 Bitcoin was created in 2009 by an unknown person, or people, using the alias Satoshi Nakamoto. It is a digital currency in the form of a line of computer code. Bitcoins are like ‘electronic cash’ which can be held or used for transactions, with holdings and transactions heavily encrypted for security – hence it is a form of ‘crytocurrency’. People can buy and sell bitcoins for normal currencies as well as using them for transactions. People’s holdings are held in electronic ‘wallets’ and can be accessed on their computers or phones via the Internet. Transfers of bitcoins from one person or organisation to another are recorded in a public electronic ledger in the form of a ‘blockchain‘.
The supply of bitcoins is not controlled by central banks; rather, it is determined by a process known as ‘mining’. This involves individuals or groups solving complex and time-consuming  mathematical problems and being rewarded with a new block of bitcoins.
The supply of bitcoins is currently growing at around 150 per hour and the current supply is around ₿16.7 million. However, the number of new bitcoins in a block is halved for every 210,000 blocks. This means that the rate of increase in the supply of bitcoins is slowing – the number generated being halved roughly every four years. The supply will eventually reach a maximum of ₿21 million, probably sometime in the next century, but around 99% will have been mined by around 2032.
The bitcoin bubble
The price of bitcoins has soared in recent months and especially in the past two. On 4 October, the price of a bitcoin was $4226; by 7 December it was nearly four times higher, at $16,858 – a rise of 399% in just nine weeks. Many people have claimed that this is a bubble, which will soon burst. Already there have been severe fluctuations. By December 10, for example, the price had fallen at one point to $13,152 – a fall of nearly 22% in just two days – only to recover to over $15,500 within a few hours.
So what determines the price of bitcoin? The simple answer is very straightforward – it’s determined by demand and supply. But what has been happening to demand and supply and why? And what will happen in the near and more distant future?
As we have seen, the supply is limited by the process of mining, which allows a relatively stable, but declining, increase. The explanation of the recent price rise and what will happen in the future lies on the demand side. Increasing numbers of people have been buying bitcoin, not because they want to use it for transactions, whether legitimate or illegal over the dark web, but because they want to invest in bitcoin. In other words, they want to hold bitcoin as an asset which is increasing in value. These people are known as ‘hodlers’ – a deliberate misspelling of ‘holders’.
But this speculation is of the destabilising form. The more prices have risen, the more people have bought bitcoin, thus pushing the price up further. This is a classic bubble, whereby the price does not reflect an underlying value, but rather the exuberance of buyers.
 The problem with bubbles is that they will burst, but just when is virtually impossible to predict with any accuracy. If the price of bitcoins falls, what will happen next depends on how the fall is interpreted. It could be interpreted as a temporary fall, caused by some people cashing in to take advantage of the higher prices. At the same time, other people, believing that it is only a temporary fall, will rush to buy, snapping up bitcoins at the temporary low price. This ‘stabilising speculation’ will move the price back up again.
However, the fall in price may be seen as the bubble bursting, with even bigger falls ahead. In this case, people will rush to sell before it falls further, thereby pushing the price even lower. This destabilising speculation will amplify the fall in prices.
But even if the bubble does burst, people may believe that another bubble will then occur and, once they think the bottom has been reached, will thus start buying again and there will be a second speculative rise in the price.
The crash could be very short-lived. This happened with the second biggest cryptocurrency, Ethereum. On 21 June this year, the price at the beginning of the day was $360. It then began to fall during the say. Once its price reached $315, it then collapsed by 96% to $13 with massive selling, much of it automatic with computers programmed to sell when the price falls by more than a certain amount. But then, on the same day, it rebounded. Within minutes it had bounced back and was trading at $337 at the end of the day. It is now trading at around $450 – up from around $300 four weeks ago.
Whether the bubble in bitcoin has more to inflate, when it will burst, and when it will rebound and by how much, depends on people’s expectations. But what we are looking at here is people’s expectations of what other people are likely to do – in other words, of other people’s expectations, which in turn depend on their expectations of other people’s expectations. This situation is known as a Keynesian Beauty Contest (see the blog, A stock market beauty contest of the machines). Perhaps we need a crystal ball.
Information site
Articles
- Is Bitcoin a bubble? Here’s what two bubble experts told us
Trade Online, Timothy B. Lee (8/12/17)
- Bitcoin and tulipmania have a lot more in common than you might think
Business Insider, Seth Archer (8/12/17)
- Bitcoin ends dramatic week with 20% slump followed by recovery
The Guardian, Jill Treanor (8/12/17)
- Putting a price on Bitcoin
The Economist, Buttonwood’s notebook (8/12/17)
- Is Bitcoin a Bubble Waiting to Pop?
InvestorPlace, Matt McCall (8/12/17)
- Bitcoin bubble follows classic pattern of investment mania
Financial Times, John Authers (8/12/17)
- The Bitcoin bubble – how we know it will burst
The Conversation, Larisa Yarovaya and Brian Lucey (6/12/17)
- Bitcoin isn’t a currency – and unless it becomes one it could be worthless
The Conversation, Vili Lehdonvirta (6/12/17)
- How Bitcoin futures trading could burst the cryptocurrency’s bubble
The Conversation, Nafis Alam (13/12/17)
- Op-ed: Bitcoin Is Not a Bubble; It’s in an S-Curve and It’s Just Getting Started
Bitcoin Magazine, Brandon Green (8/12/17)
- Bitcoin vs history’s biggest bubbles: They never end well
CNN Money, Daniel Shane (8/12/17)
- The 10 Most Ridiculous Price Bubbles In History
Business Insider, Vincent Fernando and Anika Anand (11/10/10)
- After bitcoin’s wild week, traders brace for futures launch
Reuters, Saqib Iqbal Ahmed (10/12/17)
Cryptocurrencies current market prices
Questions
- To what extent does Bitcoin meet the functions of money?
- Why is bitcoin unsuitable for normal transactions?
- To what extent is bitcoin like gold as a means of holding wealth?
- How would you advise someone thinking of buying bitcoin today? Explain why.
- Does a rapid rise in the price of an asset always indicate a bubble? Explain
- To what extent is the current rise in the price of bitcoin similar to that of the tulip, Poseidon and Beanie Baby bubbles?
- If bitcoin is appreciating relative to the dollar and other currencies, does this mean that the price of goods and services valued in bitcoin are falling? Explain.
- Explain and comment on the following sentence from the first Conversation article: “Like any asset, Bitcoin has some fundamental value, even if only a hope value, or a value arising from scarcity.”
- How might the introduction of futures trading in bitcoin impact on its price and the volatility of price swings?
- Explain and assess the argument that the price trend of bitcoin is more likely to be an S curve rather than a roller coaster
 In 2012, the Scottish Parliament voted to introduce a minimum unit price for alcoholic drinks. The Scotch Whisky Association along with others appealed against the legislation, but on 15 November 2017 the UK Supreme Court ruled unanimously that the legislation does not breach European Union law. It is thus likely that, after consultation, a 50p minimum unit price will be introduced, making Scotland the first country in the world to introduce minimum pricing for alcohol.
As we saw in a previous blog, Alcohol minimum price, the aim is to prevent the sale of really cheap drinks in supermarkets and other outlets. For example, three-litre bottles of strong cider can be sold for as little as £3.59. Sometimes supermarkets offer multibuys which are heavily discounted. The idea of minimum pricing is to stop these practices without affecting ‘normal’ prices. For example, the legislation will not affect prices in pubs, which are already more than 50p per unit of alcohol.
The following table shows how much prices would rise for various types of drink when compared to current cheap supermarket prices. The biggest percentage effect is for cheap, strong cider and beer.
|
Strength |
Size |
Units of alcohol |
Current price |
New minimum price |
| Cheap strong cider |
7.5% |
3 litres |
22.5 |
£3.50 |
£11.25 |
| Cheap wine |
13% |
750ml |
9.75 |
£3.99 |
£4.88 |
| Cheap beer/lager (normal) |
4% |
4 × 440ml |
7.04 |
£2.50 |
£3.52 |
| Cheap beer/lager (strong) |
8% |
4 × 500ml |
16 |
£3.50 |
£8.00 |
| Cheap spirits |
37.5% |
70cl |
26.25 |
£10.00 |
£13.13 |
| Cheap strong spirits |
50% |
70cl |
35 |
£12.00 |
£17.50 |
The hope is that by preventing the sale of really cheap drinks in supermarkets, people will no longer be encouraged to ‘pre-load’, so that when they go out for the evening they are already drunk. It would also help to reduce the number of alcoholics amongst the poor.

But this raises the question of equity. By targeting cheap drink, the policy is likely to hit the poor hardest. The question is whether this will simply lead to alcoholics on low incomes cutting down on other things, such as food and clothing for themselves and their children.
How successful, then, will such a policy be in cutting down drunkenness and the associated anti-social behaviour in many Scottish towns and cities, especially on Friday and Saturday nights? This will depend on the price elasticity of demand.
Videos and podcasts
Scotland first country to introduce minimum alcohol price Channel 4 News, Fatima Manji (15/11/17)
The story of how Scotland brought in minimum pricing on alcoh The Scotsman, Ross McCafferty (15/11/17)
Supreme Court rejects challenge against plans for minimum alcohol pricing in Scotland ITV News, Peter Smith (15/11/17)
Scotland getting the all-clear for minimum alcohol pricing as judges reject appeal Heart Scotland News, Connor Gillies (15/11/17)
Articles
Alcohol minimum unit pricing to go ahead Scottish Government: news (15/11/17)
Scottish alcohol price survey 2016 Alcohol Focus Scotland (2016)
Minimum pricing Alcohol Focus Scotland (2017)
Supreme Court backs Scottish minimum alcohol pricing BBC News (15/11/17)
Supreme Court backs Scottish minimum alcohol pricing plans Out-Law.com (15/11/17)
Go-ahead for minimum alcohol pricing British Medical Association (BMA), Jennifer Trueland (15/11/17)
Expert reaction to UK supreme court ruling that the Scottish government can set a minimum price for alcohol, rejecting a challenge by the Scotch Whisky Association Science Media Centre (15/11/17)
Scotland to become first country with minimum price for alcohol sales Independent, Alex Matthews-King (15/11/17)
Scotland leading the world over minimum alcohol price ITV News (15/11/17)
Campaigners urge minimum alcohol price in England after Scottish ruling The Guardian, Severin Carrell (15/11/17)
Scottish ‘booze cruises’ to England predicted as minimum pricing introduced The Telegraph, Olivia Rudgard (15/11/17)
Questions
- Draw a diagram to illustrate the effect of a minimum price per unit of alcohol on (a) cheap cider; (b) good quality wine.
- What would be the likely effects of a 50p per unit minimum price on the pub trade?
- How is the price elasticity of demand for alcoholic drinks relevant to determining the success of minimum pricing?
- What determines the price elasticity of demand for cheap alcoholic drinks?
- Compare the effects on alcohol consumption of imposing a minimum unit price of alcohol with raising the duty on alcoholic drinks. What are the revenue implications of the two policies for the government?
- What externalities are involved in the consumption of alcohol? How could a socially efficient price for alcohol be determined?
- Could alcohol consumption be described as a ‘de-merit good’? Explain.
- Other than high minimum prices and taxation, what other policies could be used to (a) tackle binge drinking; (b) tackle the problem of alcoholism?
- What will determine the number of people travelling from Scotland to England to buy cheaper alcoholic drinks?
 On 8 February, the Bank of England issued a statement that was seen by many as a warning for earlier and speedier than previously anticipated increases in the UK base rate. Mark Carney, the governor of the Bank of England, referred in his statement to ‘recent forecasts’ which make it more likely that ‘monetary policy would need to be tightened somewhat earlier and by a somewhat greater extent over the forecast period than anticipated at the time of the November report’.
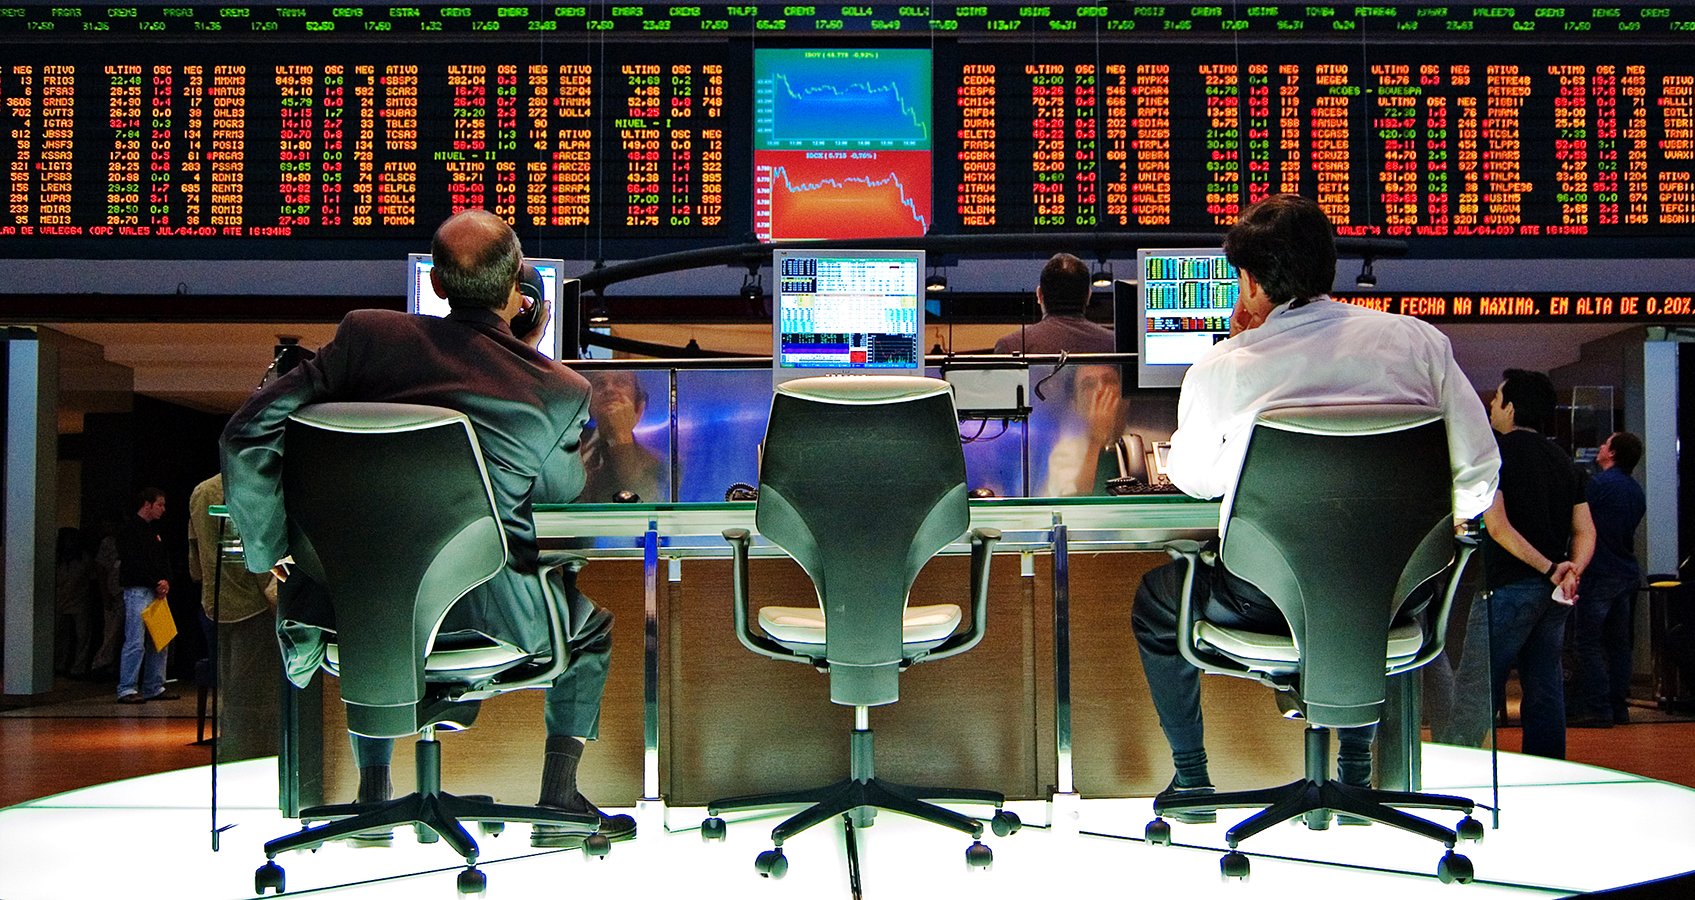 These statements have coincided with a week of sharp corrections and turbulence in the world’s largest capital markets, as investors become increasingly conscious of the threat of rising inflation – and the possibility of tighter monetary policy.


