Consumer and business confidence reflect the sentiment, emotion, or anxiety of consumers and businesses. Confidence surveys therefore try to capture these feelings of optimism or pessimism. They aim to shed light on spending intentions and hence the short-term prospects for private-sector spending. For example, a fall in confidence would be expected to lead to a fall in consumption and investment spending. This is particularly relevant in the UK with the ongoing uncertainty around Brexit. We briefly summarise here current patterns in confidence.
Through the use of surveys attempts are made to measure confidence. One long-standing survey is that conducted for the European Commission. Each month consumers and firms across the European Union are asked a series of questions, the answers to which are used to compile indicators of consumer and business confidence. For instance, consumers are asked about how they expect their financial position to change. They are offered various options such as ‘get a lot better, ‘get a lot worse’ and balances are then calculated on the basis of positive and negative replies.
The chart plots confidence in the UK for consumers and different sectors of business since the mid 1990s. The chart captures the volatility of confidence. This volatility is generally greater amongst businesses than consumers, and especially so in the construction sector. (Click here to download a PowerPoint copy of the chart.)
The chart nicely captures the collapse in confidence during the global financial crisis in the late 2000s. The significant tightening of credit conditions contributed to a significant dampening of aggregate demand which was further propagated (amplified) by the collapse in confidence. Consequently, the economy slid in to recession with national output contracting by 6.3 per cent during the 5 consecutive quarters during which output fell.
To this point, the current weakening of confidence is not of the same magnitude as that of the late 2000s. In January 2009 consumer confidence had fallen to an historic low of -35. Nonetheless, the December 2018 figure for consumer confidence was -9, the lowest figure since July 2016 the month following the EU referendum, and markedly lower than the +8 seen as recently as 2014. The long-term (median) average for the consumer confidence balance is -6.
The weakening in consumer confidence is mirrored by a weakening in confidence in the retail and service sectors. The confidence balances in December 2018 in these two sector both stood at -8 which compares to their longer-term averages of around +5. In contrast, confidence in industry and construction has so far held fairly steady with confidence levels in December 2018 at +8 in industry and at 0 in construction compared to their long-term averages of -4 and -10 respectively.
It will be interesting to see how confidence has been affected by recent events. The glut of stories suggesting that trading conditions were especially difficult for retailers over the Christmas and New Year period is consistent with the weakening confidence already observed amongst consumers and retailers. However, it is unlikely that recent events will have done anything other than to exacerbate the trend for a weakening of confidence of domestic consumers and retailers. Hence, the likelihood is an intensification of caution and prudence.
The latest consumer confidence figures from the European Commission point to consumer confidence in the UK remaining at around its long-term average. Despite this, confidence is markedly weaker than before the outcome of the EU referendum. Yet, the saving ratio, which captures the proportion of disposable income saved by the household sector, is close to its historic low. We consider this apparent puzzle and whether we can expect the saving ratio to rise.
The European Commission’s consumer confidence measure is a composite indicator based on the balance of responses to 4 forward-looking questions relating to the financial situation of households, the general economic situation, unemployment expectations and savings.
Chart 1 shows the consumer confidence indicator for the UK. The long-term average (median) of –6.25 shows that negative responses across the four questions typically outweigh positive responses. In October 2018 the confidence balance stood at –5.2, essentially unchanged from its September value of –5.8. While above the long-term average, recent values mark a weakening in confidence from levels before the EU referendum. At the beginning of 2016 the aggregate confidence score was running at around +4. (Click here to download a PowerPoint of the chart.)
Chart 1 shows two periods where consumer confidence fell markedly. The first was in the early 1990s. In 1990 the UK joined the Exchange Rate Mechanism (ERM). This was a semi-fixed exchange rate system whereby participating EU countries allowed fluctuations against each other’s currencies, but only within agreed bands, while being able to collectively float freely against all other currencies. In attempting to staying in the ERM, the UK was obliged to raise interest rates in order to protect the pound. The hikes to rates contributed to a significant dampening of aggregate demand and the economy slid into recession. Britain crashed out of the ERM in September 1992.
The second period of declining confidence was during the global financial crisis in the late 2000s. The retrenchment among financial institutions meant a significant tightening of credit conditions. This too contributed to a significant dampening of aggregate demand and the economy slid into recession. Whereas the 1992 recession saw the UK national output contract by 2.0 percent, this time national output fell by 6.3 per cent.
The collapses in confidence from 1992 and from 2007/08 are likely to have helped propagate the effects of the fall in aggregate demand that were already underway. The weakening of confidence in 2016 is perhaps a better example of a ‘confidence shock’, i.e. a change in aggregate demand originating from a change in confidence. Nonetheless, a fall in confidence, whether it amplifies existing shocks or is the source of the shock, is often taken as a signal of greater economic uncertainty. If we take this greater uncertainty to reflect a greater range of future income outcomes, including potential income losses, then households may look to insure themselves by increasing current saving.
It is usual to assume that people suffer from diminishing marginal utility of total consumption. This means that while total satisfaction increases as we consume more, the additional utility from consuming more (marginal utility) decreases. An implication of this is that a given loss of consumption reduces utility by more than an equivalent increase in consumption increases utility. This explains why people prefer more consistent consumption levels over time and so engage in consumption smoothing. The utility, for example, from an ‘average’ consumption level across two time periods, is higher, than the expected utility from a ‘low’ level of consumption in period 1 and a ‘high’ level of consumption in period 2. This is because the loss of utility from a ‘low’ level of consumption relative to the ‘average’ level is greater than the additional utility from the ‘high’ level relative to the ‘average’ level.
If greater uncertainty, such as that following the EU referendum, increases the range of possible ‘lower’ consumption values in the future even when matched by an increase in the equivalent range of possible ‘higher’ consumption values, then expected future utility falls. The incentive therefore is for people to build up a larger buffer stock of saving to minimise utility losses if the ‘bad state’ occurs. Hence, saving which acts as a from of self-insurance in the presence of uncertainty is known as buffer-stock saving or precautionary saving.
Chart 2 plots the paths of the UK household-sector saving ratio and consumer confidence. The saving ratio approximates the proportion of disposable income saved by the household sector. What we might expect to see if more uncertainty induces buffer-stock saving is for falls in confidence to lead to a rise in the saving ratio. Conversely, less uncertainty as proxied by a rise in confidence would lead to a fall in the saving ratio. (Click here to download a PowerPoint of the chart.)
The chart provides some evidence that of this. The early 1990s and late 2000s certainly coincided with both waning confidence and a rising saving ratio. The saving ratio rose to as high as 15.2 per cent in 1993 and 12.0 per cent in 2009. Meanwhile the rising confidence seen in the late 1990s coincided with a fall in the saving ratio to 4.7 per cent in 1999.
As Chart 2 shows, the easing of confidence since 2016 has coincided with a period where the saving ratio has been historically low. Across 2017 the saving ratio stood at just 4.5 per cent. In the first half of 2018 the ratio averaged just 4.2 per cent. While the release of the official figures for the saving ratio are less timely than those for confidence, the recent very low saving ratio may be seen to raise concerns. Can softer confidence data continue to co-exist with such a low saving ratio?
There are a series of possible explanations for the recent lows in the saving ratio. On one hand, the rate of price inflation has frequently exceeded wage inflation in recent years so eroding the real value of earnings. This has stretched household budgets and limited the amount of discretionary income available for saving. On the other hand, unemployment rates have fallen to historic lows. The rate of unemployment in the three months to August stood at 4 per cent, the lowest since 1975. Unemployment expectations are important in determining levels of buffer stock saving because of the impact of unemployment on household budgets.
Another factor that has fuelled the growth of spending relative to income, has been the growth of consumer credit. In the period since July 2016, the annual rate of growth of consumer credit, net of repayments, has averaged 9.7 per cent. Behavioural economists argue that foregoing spending can be emotionally painful. Hence, spending has the potential to exhibit more stickiness than might otherwise be predicted in a more uncertain environment or in the anticipation of income losses. Therefore, the reluctance or inability to wean ourselves off credit and spending might be a reason for the continuing low saving ratio.
We wait to see whether the saving ratio increases over the coming months. However, for now, the UK household sector appears to be characterised by low saving and fragile confidence. Whether or not this is a puzzle, is open to question. Nonetheless, it does appear to carry obvious risks should weaker income growth materialise.
Draw up a series of factors that you think might affect consumer confidence.
Which of the following statements is likely to be more accurate: (a) Consumer confidence drives economic activity or (b) Economic activity drives consumer confidence?
What macroeconomic indicators would those compiling the consumer confidence indicator expect the indicator to predict?
How does the diminishing marginal utility of consumption (or income) help explain why people engage in buffer stock saving (precautionary saving)?
How might uncertainty affect consumer confidence?
How does greater income uncertainty affect expected utility? What affect might this have on buffer stock saving?
Would you start a family if you were pessimistic about the future of the economy? Buckles et al (2017) (see link below) believe that fewer of us would do so and, therefore, fertility rates could be used by investors and central banks as an early signal to pick up subtle changes in consumer confidence and overall economic climate.
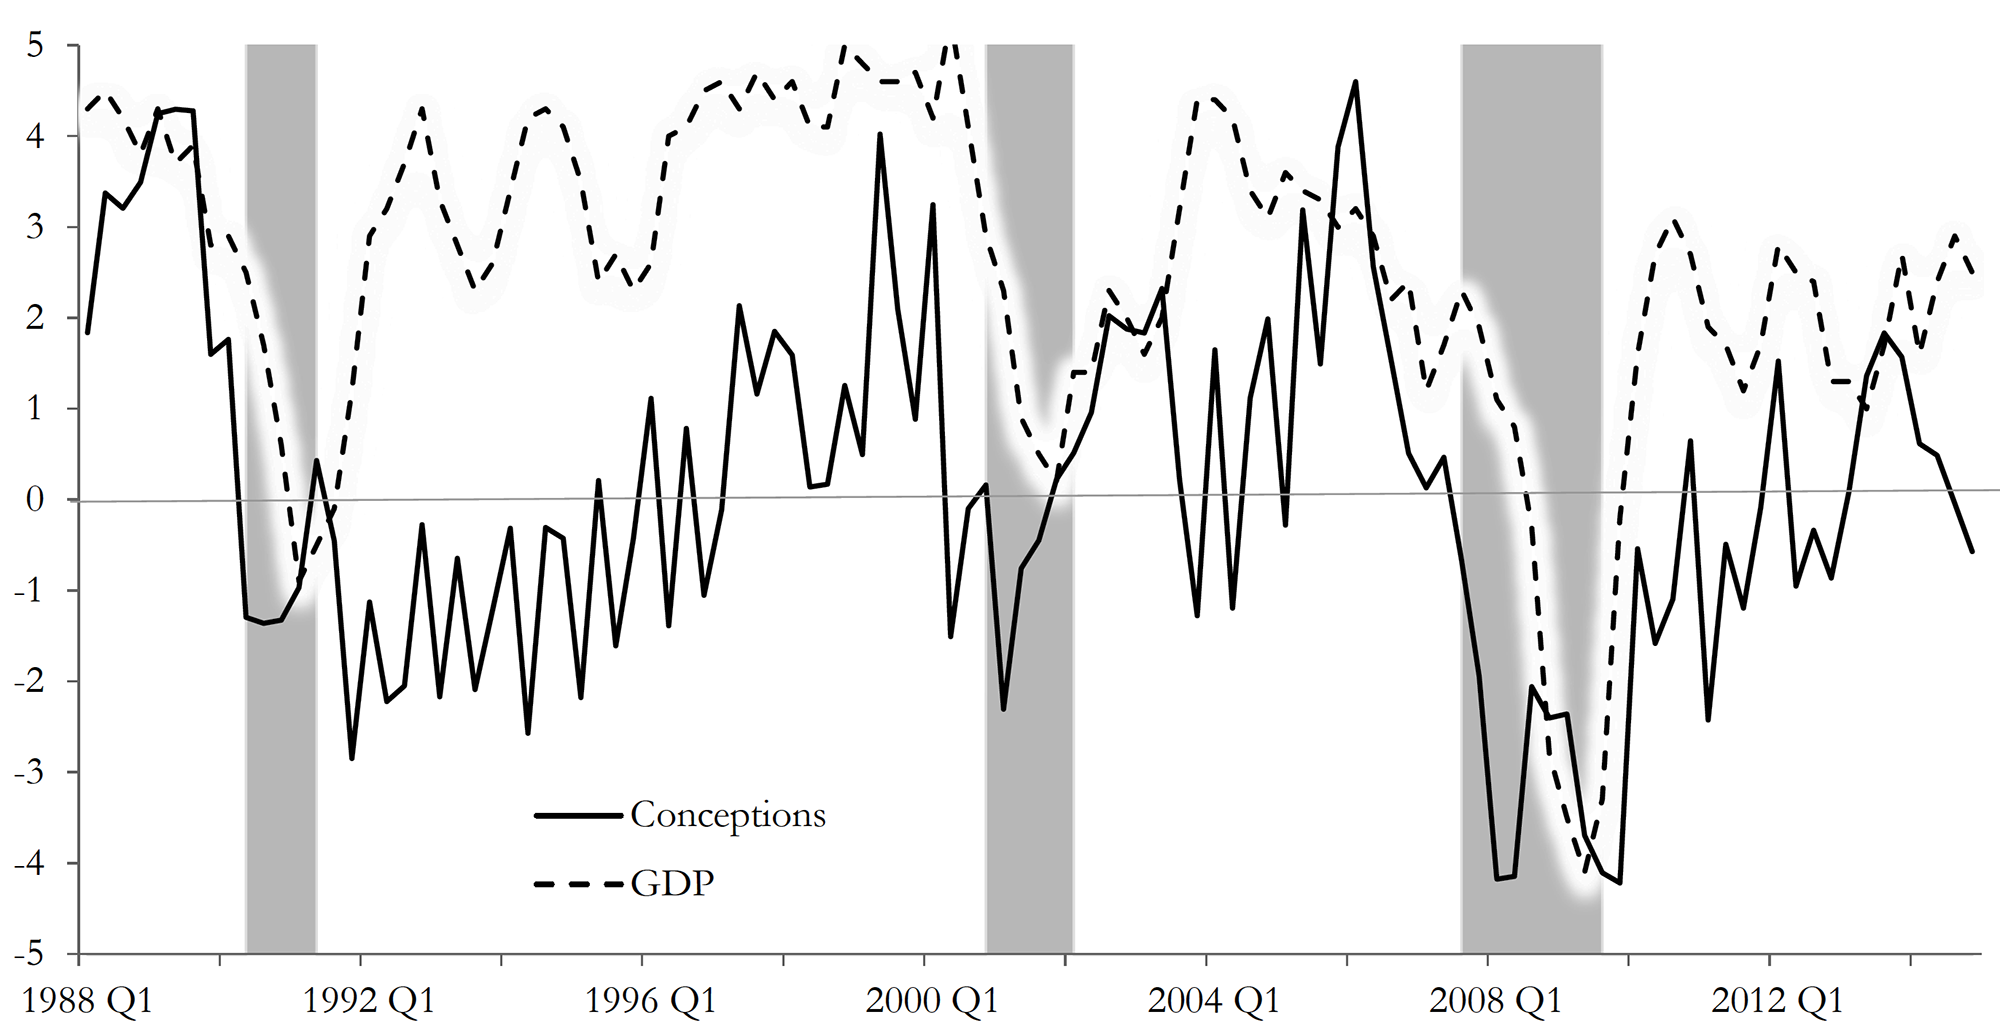
Their study titled ‘Fertility is a leading economic indicator’ uses ‘live births’ data, sourced from US birth certificates, to explore if there is any association between fertility changes (measured as the rate of change in number of births) and GDP growth. Their results suggest that, in the case of the USA, there is: dips in fertility rates tend to precede by several quarters slowdown in economic activity. As the authors state:
The growth rate of conceptions declines prior to economic downturns and the decline occurs several quarters before recessions begin. Our measure of conceptions is constructed using live births; we present evidence suggesting that our results are indeed driven by changes in conceptions and not by changes in abortion or miscarriage. Conceptions compare well with or even outperform other economic indicators in anticipating recessions.
Conception and GDP Growth Rates (source Buckles et al p33: see below)
Although this is not the first piece of academic writing to claim that fertility has pro-cyclical qualities (see for instance, Adsera (2004, 2011), Adsera and Menendez (2011), Currie and Schwandt (2014) and Chatterjee and Vogle (2016) linked below), it is, to the best of our knowledge, the most recent paper (in terms of data used) to depict this relationship and to explore the suitability of fertility as a macroeconomic indicator to predict recessions.
Economies, after all, are groups of people who participate actively in day-to-day production and consumption activities – as consumers, workers and business leaders. Changes in their environment should affect their expectations about the future.
Are people, however, forward-looking enough to guide their current behaviours by their expectations of future economic outcomes? They may be, according to the findings of this study.
Did you know, for instance, that sales of ties tend to increase in economic downturns, as men buy more ties to show that they are working harder, in fear of losing their job[1]? But this is probably a topic for another blog.
Give two reasons why fertility rates may be a good indicator of economic activity.
Give two reasons why fertility rates may NOT be a good indicator of economic activity.
Do a literature search to identify and explain an ‘unorthodox’ macroeconomic indicator of your choice, and how it has been used to track economic activity.
These are challenging times for business. Economic growth has weakened markedly over the past 18 months with output currently growing at an annual rate of around 1.5 per cent, a percentage point below the long-term average. Spending power continues to be squeezed, with the annual rate of inflation in October reported to be running at 3.1 per cent compared to annual earnings growth of 2.5 per cent (see the squeeze continues). Moreover, consumer confidence remains fragile with households continuing to express particular concerns about the general economy and unemployment.
Here, we update our blog of July 2016 which, following the UK vote to leave the European Union, noted the fears for UK growth as confidence fell sharply. Consumer confidence is frequently identified by macro-economists as an important source of economic volatility. Indeed many macro models use a change in consumer confidence as a means of illustrating how economic shocks affect a range of macro variables, including growth, employment and inflation. Many economists agree that, in the short term at least, falling levels of confidence adversely affect activity because aggregate demand falls as households spend less.
The European Commission’s confidence measure is collated from questions in a monthly survey. In the UK around 2000 individuals are surveyed. Across the EU as a whole over 41 000 people are surveyed. In the survey individuals are asked a series of 12 questions which are designed to provide information on spending and saving intentions. These questions include perceptions of financial well-being, the general economic situation, consumer prices, unemployment, saving and the undertaking of major purchases.
The responses elicit either negative or positive responses. For example, respondents may feel that over the next 12 months the financial situation of their household will improve a little or a lot, stay the same or deteriorate a little or a lot. A weighted balance of positive over negative replies can be calculated. The balance can vary from -100, when all respondents choose the most negative option, to +100, when all respondents choose the most positive option.
The European Commission’s principal consumer confidence indicator is the average of the balances of four of the twelve questions posed: the financial situation of households, the general economic situation, unemployment expectations (with inverted sign) and savings, all over the next 12 months. These forward-looking balances are seasonally adjusted. The aggregate confidence indicator is thought to track developments in households’ spending intentions and, in turn, likely movements in the rate of growth of household consumption.
Chart 1 shows the consumer confidence indicator for the UK. The long-term average of –8.6 shows that negative responses across the four questions typically outweigh positive responses. In November 2017 the confidence balance stood at -5.2 roughly on par with its value in the previous two months, though marginally up on values of close to -7 over the summer. However, as recently as the beginning of 2016 the aggregate confidence score was running at around +4. In this context, current levels do constitute a significant change in consumer sentiment, changes which do ordinarily mark similar turning points in economic activity.(Click here to download a PowerPoint of the chart.)
Chart 2 allows to look behind the European Commission’s headline confidence indicator for the UK by looking at its four component balances. From it, we can see a deterioration in all four components. However, by far the most significant change in the individual confidence balances has been the sharp deterioration in expectations for the general economy. In November the forward-looking general economic situation stood at -25.5, compared to its long-run average of -11.6. (Click here to download a PowerPoint of the chart.)
The fall in UK consumer confidence is even more stark when compared to developments in consumer confidence across the whole of the European Union and in the 19 countries that make up the Euro area. Chart 3 shows how UK consumer confidence recovered relatively more strongly following the financial crisis of the late 2000s. The headline confidence indicator rose strongly from the middle of 2013 and was consistently in positive territory during 2014, 2015 and into 2016. The fall in consumer confidence in the UK has seen the headline confidence measure fall below that for the EU and the euro area. (Click here to download a PowerPoint of the chart.)
Consumer (and business) confidence is closely linked to uncertainty. The circumstances following the UK vote to leave the EU have undoubtedly created the conditions for acute uncertainty. Uncertainty breeds caution. Economists sometimes talk about spending being affected by two conflicting motives: prudence and impatience. While impatience creates a desire for spending now, prudence pushes us towards saving and insuring ourselves against uncertainty and unforeseen events. The worry is that the twin forces of fragile confidence and squeezed real earning are weighting heavily in favour of prudence and patience (a reduction in impatience). Going forward, this could create the conditions for a sustained period of subdued growth which, if it were to impact heavily on firms’ investment plans, could adversely impact on the economy’s productive potential. The hope is that the Brexit negotiations can move apace to reduce uncertainty and limit uncertainty’s adverse impact on economic activity.
Draw up a series of factors that you think might affect consumer confidence.
Explain what you understand by a positive and a negative demand-side shock. How might changes in consumer confidence generate demand shocks?
Analyse the ways in which consumer confidence might affect economic activity.
Which of the following statements is likely to be more accurate: (a) Consumer confidence drives economic activity or (b) Economic activity drives consumer confidence?
What macroeconomic indicators would those compiling the consumer confidence indicator expect the indicator to predict?
Analyse the possible short-term and longer-term economic implications of a fall in consumer confidence.
How might uncertainty affect consumer confidence?
What do the concepts of impatience and prudence mean in the context of consumer spending? When consumer confidence falls which of these might become more significant for consumer spending?
In our blog What can we read into signs of easing consumer confidence? we noted the slight easing in consumer confidence that had occurred since the autumn of last year. Nonetheless, at that time, survey data from the European Commission was continuing to show consumer confidence levels still well above their long-run average. However, following the UK vote to leave the European Union consumer confidence has fallen sharply and now the headline confidence indicator has fallen below its long-term average for the first time since June 2013.
We take this opportunity to update our May blog to better understand the extent and nature of the decline in confidence. The importance of confidence changes is typically modelled by economists in their models of the macroeconomy as a demand-side shock. Falling consumer confidence would be expected to dampen an economy’s output levels since aggregate demand falls as households spend less. Consequently, a marked fall in confidence amounts to a negative demand-side shock.
The European Commission’s confidence measure is collated from questions in a monthly survey. In the UK around 2000 individuals are surveyed. Across the current 28 member states over 41 000 people are surveyed.
In the survey individuals are asked a series of 12 questions which are designed to provide information on spending and saving intentions. These questions include perceptions of financial well-being, the general economic situation, consumer prices, unemployment, saving and the undertaking of major purchases.
The responses elicit either negative or positive responses. For example, respondents may feel that over the next 12 months the financial situation of their household will improve a little or a lot, stay the same or deteriorate a little or a lot. A weighted balance of positive over negative replies can be calculated. The balance can vary from –100, when all respondents choose the most negative option, to +100, when all respondents choose the most positive option.
The European Commission’s principal consumer confidence indicator is the average of the balances of four of the twelve questions posed: the financial situation of households, the general economic situation, unemployment expectations (with inverted sign) and savings, all over the next 12 months. These forward-looking balances are seasonally adjusted.
Sometimes other combinations of the 12 questions are averaged to produce alternative headline confidence numbers (see, for example, the newspaper articles below). These may include a mix of forward and backward-looking questions. However, in this blog we report on the European Commission’s principal confidence indicator as outlined above. The intention is that this or any other confidence indicator tracks developments in households’ spending intentions and, in turn, likely changes in the rate of growth of household consumption.
Chart 1 shows the consumer confidence indicator for the UK. The long-term average of –8.7 shows that negative responses across the four questions typically outweigh positive responses.
In July the confidence balance stood at –9.2 down from –1.2 in June. This 8 point fall is the largest monthly fall in this particular headline indicator since January 1991 when it fell 11 points. The fall also means that not only do negative responses now dominate but more so than is usual. The fall in confidence is therefore very stark indeed. (Click here to download a PowerPoint of the chart.)
Chart 2 is important because it enables us to see what drives the European Commission’s headline confidence indicator for the UK by looking at its four component balances. The sharp decline in confidence is reflected in a deterioration in all four components. (Click here to download a PowerPoint of the chart.)
The most notable change in the individual confidence balances is the sharp deterioration in expectations for the general economy. In July the forward-looking general economic situation balance fell to –29.9 having stood at –15.7 in June. As recently as last December it registered –1.4. This is the lowest forward-looking general economy confidence balance since October 2012, though still some way above the –50.1 reported in July 2008 when the financial crisis was unfolding.
Alongside the 14 point drop in the balance for general economy expectations, the UK experienced 8 point drops in both the balances for households’ financial expectations and the expectations of saving over the next 12 months. In other words, households expect to become financially poorer and less able to save.
The monthly survey contains other questions that can help to predict future spending patterns. For example, we might expect the responses to questions relating to perceptions around what the survey call ‘major purchases’ to give us some important insight in households’ financial well-being and spending plans. ‘Major purchases’ are taken to be items such as furniture, electrical goods and electronic devices.
Chart 3 shows the balances to both whether now is the right time to make major purchases and to whether respondents expect to spend more on major purchases in the coming 12 months compared to the past 12 months. July’s data show a marked deterioration in sentiment towards making major purchases. The balance relating to whether now is the right time to make major purchases fell by 6.5 points, the largest fall since December 2011, while the forward-looking major purchase balance fell by 4.6 points, the largest fall since January 2011. (Click here to download a PowerPoint of the chart.)
The fall in the major purchases balances is consistent with the idea that households are feeling a sense of heightened uncertainty. The implication of this is that households will tend to be more cautious, cutting back on expenditures, including major purchases.
The magnitude of the fall in UK consumer confidence following the outcome of the EU referendum on 23 June is even more stark when compared to developments in consumer confidence across the 28 member states of the European Union and in the 19 countries that make up the Euro area.
Chart 4 shows how UK consumer confidence recovered relatively more strongly following the financial crisis of the late 2000s. The headline confidence indicator rose strongly from the middle of 2013 and, as we noted earlier, was consistently in positive territory during 2014 and remained so at the start of this year. The slump in consumer confidence in the UK means that the headline confidence measure has now fallen below that across the EU as well as that in the euro area. In fact, confidence in the euro area has been consistently between –7 or –9 for the past six months. (Click here to download a PowerPoint of the chart.)
Interest now turns to whether the slump in confidence in the UK will persist or, worse still, deepen further. The implied negative impact on aggregate demand would be expected to translate into weaker growth. The concern therefore is the extent to which we can expect UK growth to weaken in the months ahead. The prospect of weaker growth is likely to influence economic policy.
The government has already talked about ‘resetting fiscal policy’ which can be taken to mean a relative loosening in its fiscal policy relative to the Government’s original plans. Similarly we might yet see a further loosening of monetary policy. While the Bank of England’s Monetary Policy Committee held the official Bank Rate at 0.5 per cent at its July meeting, many commentators expect a cut sooner rather than later. The confidence data will be one important consideration in the Bank’s calculations.
Draw up a series of factors that you think might affect consumer confidence.
Analyse the ways in which consumer confidence might affect economic activity.
Explain what you understand by a positive and a negative demand-side shock. How might changes in consumer confidence initiate demand shocks?
Which of the following statements is likely to be more accurate? (a) Consumer confidence drives economic activity. (b) Economic activity drives consumer confidence.
What macroeconomic indicators would those compiling the consumer confidence indicator hope that the indicator would help to predict?
Analyse the possible economic implications of the fall in consumer confidence following the EU referendum vote.
What economic effects might any persistence in the fall in consumer confidence have?
 Consumer and business confidence reflect the sentiment, emotion, or anxiety of consumers and businesses. Confidence surveys therefore try to capture these feelings of optimism or pessimism. They aim to shed light on spending intentions and hence the short-term prospects for private-sector spending. For example, a fall in confidence would be expected to lead to a fall in consumption and investment spending. This is particularly relevant in the UK with the ongoing uncertainty around Brexit. We briefly summarise here current patterns in confidence.
  The chart plots confidence in the UK for consumers and different sectors of business since the mid 1990s. The chart captures the volatility of confidence. This volatility is generally greater amongst businesses than consumers, and especially so in the construction sector. (Click here to download a PowerPoint copy of the chart.)
 Chart 1 shows the consumer confidence indicator for the UK. The long-term average (median) of –6.25 shows that negative responses across the four questions typically outweigh positive responses. In October 2018 the confidence balance stood at –5.2, essentially unchanged from its September value of –5.8. While above the long-term average, recent values mark a weakening in confidence from levels before the EU referendum. At the beginning of 2016 the aggregate confidence score was running at around +4. (Click
  Chart 2 plots the paths of the UK household-sector saving ratio and consumer confidence. The saving ratio approximates the proportion of disposable income saved by the household sector. What we might expect to see if more uncertainty induces buffer-stock saving is for falls in confidence to lead to a rise in the saving ratio. Conversely, less uncertainty as proxied by a rise in confidence would lead to a fall in the saving ratio. (Click