 On 8 February, the Bank of England issued a statement that was seen by many as a warning for earlier and speedier than previously anticipated increases in the UK base rate. Mark Carney, the governor of the Bank of England, referred in his statement to ‘recent forecasts’ which make it more likely that ‘monetary policy would need to be tightened somewhat earlier and by a somewhat greater extent over the forecast period than anticipated at the time of the November report’.
A similar picture emerges on the other side of the Atlantic. With labour markets continuing to deliver spectacularly high rates of employment (the highest in the last 17 years), there are also now signs that wages are on an upward trajectory. According to a recent report from the US Bureau of Labor Statistics, US wage growth has been stronger than expected, with average hourly earnings rising by 2.9 percent – the strongest growth since 2009.
 These statements have coincided with a week of sharp corrections and turbulence in the world’s largest capital markets, as investors become increasingly conscious of the threat of rising inflation – and the possibility of tighter monetary policy.
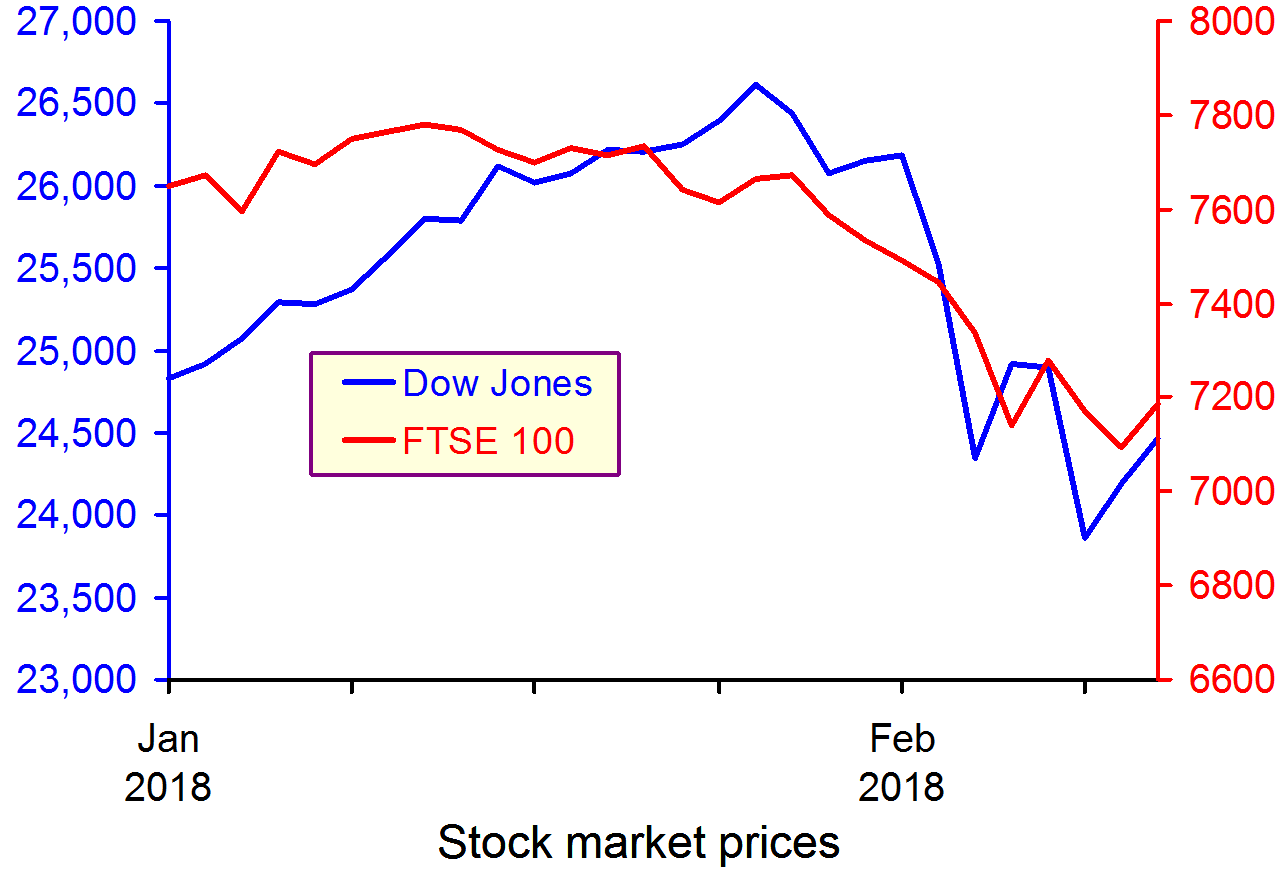
The Dow Jones plunged from an all-time high of 26,186 points on 1 February to 23,860 a week later – losing more than 10 per cent of its value in just five trading sessions (suffering a 4.62 percentag fall on 5 February alone – the worst one-day point fall since 2011). European and Asian markets followed suit, with the FTSE-100, DAX and NIKKEI all suffering heavy losses in excess of 5 per cent over the same period.
 But why should higher inflationary expectations fuel a sell-off in global capital markets? After all, what firm wouldn’t like to sell its commodities at a higher price? Well, that’s not entirely true. Investors know that further increases in inflation are likely to be met by central banks hiking interest rates. This is because central banks are unlikely to be willing or able to allow inflation rates to rise much above their target levels.
The Bank of England, for instance, sets itself an inflation target of 2%. The actual ongoing rate of inflation reported in the latest quarterly Inflation Report is 3% (50 per cent higher than the target rate).
Any increase in interest rates is likely to have a direct impact on both the demand and the supply side of the economy.
Consumers (the demand side) would see their cost of borrowing increase. This could put pressure on households that have accumulated large amounts of debt since the beginning of the recession and could result in lower consumer spending.
Firms (the supply side) are just as likely to suffer higher borrowing costs, but also higher operational costs due to rising wages – both of which could put pressure on profit margins.
It now seems more likely that we are coming towards the end of the post-2008 era – a period that saw the cost of money being driven down to unprecedentedly low rates as the world’s largest economies dealt with the aftermath of the Great Recession.
For some, this is not all bad news – as it takes us a step closer towards a more historically ‘normal’ equilibrium. It remains to be seen how smooth such a transition will be and to what extent the high-leveraged world economy will manage to keep its current pace, despite the increasingly hawkish stance in monetary policy by the world’s biggest central banks.
Video
 Dow plunges 1,175 – worst point decline in history CNN Money, Matt Egan (5/2/18)
Articles
Global Markets Shed $5.2 Trillion During the Dow’s Stock Market Correction Fortune, Lucinda Shen (9/2/18)
Bank of England warns of larger rises in interest rates Financial Times, Chris Giles and Gemma Tetlow (8/2/18)
Stocks are now in a correction — here’s what that means Business Insider, Andy Kiersz (8/2/18)
US economy adds 200,000 jobs in January and wages rise at fastest pace since recession Business Insider, Akin Oyedele (2/2/18)
Questions
- Using supply and demand diagrams, explain the likely effect of an increase in interest rates to equilibrium prices and output. Is it good news for investors and how do you expect them to react to such hikes? What other factors are likely to influence the direction of the effect?
- Do you believe that the current ultra-low interest rates could stay with us for much longer? Explain your reasoning.
- What is likely to happen to the exchange rate of the pound against the US dollar, if the Bank of England increases interest rates first?
- Why do stock markets often ‘overshoot’ in responding to expected changes in interest rates or other economic variables
 OPEC, for some time, was struggling to control oil prices. Faced with competition from the fracking of shale oil in the USA, from oil sands in Canada and from deep water and conventional production by non-OPEC producers, its market power had diminished. OPEC now accounts for only around 40% of world oil production. How could a ‘cartel’ operate under such conditions?
One solution was attempted in 2014 and 2015. Faced with plunging oil prices which resulted largely from the huge increase in the supply of shale oil, OPEC refused to cut its output and even increased it slightly. The aim was to keep prices low and to drive down investment in alternative sources, especially in shale oil wells, many of which would not be profitable in the long term at such prices.
In late 2016, OPEC changed tack. It introduced its first cut in production since 2008. In September it introduced a new quota for its members that would cut OPEC production by 1.2 million barrels per day. At the time, Brent crude oil price was around $46 per barrel.
In December 2016, it also negotiated an agreement with non-OPEC producers, and most significantly Russia, that they would also cut production, giving a total cut of 1.8 million barrels per day. This amounted to around 2% of global production. In March 2017, it was agreed to extend the cuts for the rest of the year and in November 2017 it was agreed to extend them until the end of 2018.
With stronger global economic growth in 2017 and into 2018 resulting in a growth in demand for oil, and with OPEC and Russia cutting back production, oil prices rose rapidly again (see chart: click here for a PowerPoint). By January 2018, the Brent crude price had risen to around $70 per barrel.

Low oil prices had had the effect of cutting investment in shale oil wells and other sources and reducing production from those existing ones which were now unprofitable. The question being asked today is to what extent oil production from the USA, Canada, the North Sea, etc. will increase now that oil is trading at around $70 per barrel – a price, if sustained, that would make investment in many shale and other sources profitable again, especially as costs of extracting shale oil is falling as fracking technology improves. US production since mid-2016 has already risen by 16% to nearly 10 million barrels per day. Costs are also falling for oil sand and deep water extraction.
In late January 2018, Saudi Arabia claimed that co-operation between oil producers to limit production would continue beyond 2018. Shale oil producers in the USA are likely to be cheered by this news – unless, that is, Saudi Arabia and the other OPEC and non-OPEC countries party to the agreement change their minds.
Videos
OPEC’s Control of the Oil Market Is Running on Fumes Bloomberg (21/12/17)
Oil Reaches $70 a Barrel for First Time in Three Years Bloomberg, Stuart Wallace (11/1/18)
Banks Increasingly Think OPEC Will End Supply Cuts as Oil Hits $70 Bloomberg, Grant Smith (15/1/18)
Articles
Oil prices rise to hit four-year high of $70 a barrel BBC News (11/1/18)
Overshooting? Oil hits highest level in almost three years, with Brent nearing $70 Financial Times, Anjli Raval (10/1/18)
Can The Oil Price Rally Continue? OilPrice, Nick Cunningham (14/1/18)
Will This Cause An Oil Price Reversal? OilPrice, Olgu Okumus (22/1/18)
The world is not awash in oil yet
Arab News, Wael Mahdi (14/1/15)
‘Explosive’ U.S. oil output growth seen outpacing Saudis, Russia CBC News (19/1/18)
Oil’s Big Two seeking smooth exit from cuts The Business Times (23/1/18)
Saudi comments push oil prices higher BusinessDay, Henning Gloystein (22/1/18)
Report
Short-term Energy Outlook U.S. Energy Information Administration (EIA) (9/1/18)
Questions
- Using supply and demand diagrams, illustrate what has happened to oil prices and production over the past five years. What assumptions have you made about the price elasticity of supply and demand in your analysis?
- If the oil price is above the level at which it is profitable to invest in new shale oil wells, would it be in the long-term interests of shale oil companies to make such investments?
- Is the structure of the oil industry likely to result in long-term cycles in oil prices? Explain why or why not.
- Investigate the level of output from, and investment in, shale oil wells over the past three years. Explain what has happened.
- Would it be in the interests of US producers to make an agreement with OPEC on production quotas? What would prevent them from doing so?
- What is likely to happen to oil prices over the coming 12 months? What assumptions have you made and how have they affected your answer?
- If the short-term marginal costs of operating shale oil wells is relatively low (say, below $35 per barrel) but the long-term marginal cost (taking into account the costs of investing in new wells) is relatively high (say, over $65 per barrel) and if the life of a well is, say, 5 years, how is this likely to affect the pattern of prices and output over a ten-year period? What assumptions have you made and how do they affect your answer?
- If oil production from countries not party to the agreement between OPEC and non-OPEC members increases rapidly and if, as a result, oil prices start to fall again, what would it be in OPEC’s best interests to do?
 Each January, world political and business leaders gather at the ski resort of Davos in Switzerland for the World Economic Forum. They discuss a range of economic and political issues with the hope of guiding policy.
This year, leaders meet at a time when the global political context has and is changing rapidly. This year the focus is on ‘Creating a Shared Future in a Fractured World’. As the Forum’s website states:
The global context has changed dramatically: geostrategic fissures have re-emerged on multiple fronts with wide-ranging political, economic and social consequences. Realpolitik is no longer just a relic of the Cold War. Economic prosperity and social cohesion are not one and the same. The global commons cannot protect or heal itself.
 One of the main ‘fissures’ which threatens social cohesion is the widening gap between the very rich and the rest of the world. Indeed, inequality and poverty is one of the main agenda items at the Davos meeting and the Forum website includes an article titled, ‘We have built an unequal world. Here’s how we can change it’ (see second link in the Articles below). The article shows how the top 1% captured 27% of GDP growth between 1980 and 2016.
The first Guardian article below identifies seven different policy options to tackle the problem of inequality of income and wealth and asks you to say, using a drop-down menu, which one you think is most important. Perhaps it’s something you would like to do.
Articles
Project Davos: what’s the single best way to close the world’s wealth gap? The Guardian, Aidan Mac Guill (19/1/18)
We have built an unequal world. Here’s how we can change it World Economic Forum, Winnie Byanyima (22/1/18)
Oxfam highlights sharp inequality as Davos elite gathers ABC news, Pan Pylas (21/1/18)
Inequality gap widens as 42 people hold same wealth as 3.7bn poorest The Guardian, Larry Elliott (22/1/18)
There’s a huge gender component to income inequality that we’re ignoring Business Insider, Pedro Nicolaci da Costa (22/1/18)
Ahead of Davos, even the 1 percent worry about inequality Washington Post, Heather Long (22/1/18)
“Fractures, Fears and Failures:” World’s Ruling Elites Stare into the Abyss GlobalResearch, Bill Van Auken (18/1/18)
Why the world isn’t getting a pay raise CNN Money, Patrick Gillespie and Ivana Kottasová (1/11/17)
WEF archive
Articles on Inequality World Economic Forum
Questions
- Distinguish between income and wealth. In global terms, which is distributed more unequally?
- Why has global inequality of both income and wealth grown?
- Explain which of the seven policy options identified by the Guardian you would choose/did choose?
- Go through each one of the seven policy options and identify what costs would be associated with pursuing it.
- Identify any other policy options for tackling the problem.
 Each year for the past 60 years, the ONS has published ‘Family Spending’, which ‘gives an insight into the spending habits of UK households, broken down by household characteristics and types of spending’. The latest issue, covering the financial year ending 2017, has just been released.
To mark the 60th anniversary, the ONS has also published a blog, Celebrating 60 years of Family Spending, which compares spending patterns in 2017 with those in 1957. The blog looks at the percentage of the family budget spent on various categories, such as food, clothing, housing, tobacco and alcohol. Some of the percentages have changed dramatically over the years; others have hardly changed at all.
Before you read on, of the six categories mentioned above, which do you think have increased, which fallen and which stayed the same? What is your reasoning?
 Differences in patterns of consumption partly reflect incomes. In 1957, real household income was £381 in today’s prices; today it’s £544 (43% more). You would expect, therefore, that a greater proportion of household incomes today would be spent on more luxurious goods, with a higher income elasticity of demand.
Other changes in consumption patterns reflect changes in tastes and attitudes. Thus there has been a huge fall in the proportion of household income spent on tobacco – down from 6% in 1957 to 1% in 2017.
 Three of the biggest changes over the 60 years have been in housing costs, food and clothing. Housing costs (rent, mortgage interest, council tax, maintenance and home repairs) have doubled from around 9% to around 18% (although they were around 20% before the huge fall in interest rates following the financial crisis of 2007–8). Expenditure on food, by contrast, has fallen – from around 33% to around 16%. Expenditure on clothing has also fallen, from around 10% to around 5%.
Expenditure on alcohol, on the other hand, having risen somewhat in the 1970s and 80s, is roughly the same today as it was 60 years ago, at around 3% of household expenditure.
 Some of the explanations for these changing patterns can be found on the supply side – changing costs of production, new technologies and competition; others can be found on the demand side – changes in tastes and changes in incomes. Some goods and services which we use today, such as computers, mobile phones, many other electrical goods, high-tech gyms and social media were simply not available 60 years ago.
Articles
Celebrating 60 years of Family Spending ONS blog, Joanna Bulman (18/1/18)
How did households budget in 1957? BBC News, Simon Gompertz (18/1/18)
Rising burden of housing costs shown by 60-year UK spending survey Financial Times, Gemma Tetlow (18/1/18)
Data
Family spending in the UK: financial year ending 2017 ONS Statistical Bulletin (18/1/18)
All data related to Family spending in the UK: financial year ending 2017 ONS datasets (18/1/18)
Questions
- Why has expenditure on housing increased so much as a proportion of household expenditure? What underlying factors help to explain this?
- Why has expenditure on food fallen as a proportion of household expenditure? Are the explanations on both the demand and supply sides?
- What has happened to the proportion of expenditure going on leisure goods and services? Explain.
- What factors affect the proportion of expenditure going on motoring?
- Of the broad categories of expenditure considered in this blog, which would you expect to increase, which to decrease and which to stay roughly the same over the coming 10 years? Why?
- If expenditure on a particualar good falls as a percentage of total expenditure as income rises, does this make it an inferior good? Explain.
 On 15 January 2018, Carillion went into liquidation. It was a major construction, civil engineering and facilities management company in the UK and was involved in a large number of public- and private-sector projects. Many of these were as a partner in a joint venture with other companies.
It was the second largest supplier of construction and maintenance services to Network Rail, including HS2. It was also involved in the building of hospitals, including the new Royal Liverpool University Hospital and Midland Metropolitan Hospital in Smethwick. It also provided maintenance, cleaning and catering services for many schools, universities, hospitals, prisons, government departments and local authorities. In addition it was involved in many private-sector projects.
Much of the work on the projects awarded to Carillion was then outsourced to other companies, many of which are small construction, maintenance, equipment and service companies. A large number of these may themselves be forced to close as projects cease and many bills remain unpaid.
Many of the public-sector projects in which Carillion was involved were awarded under the Public Finance Initiative (PFI). Under the scheme, the government or local authority decides the service it requires, and then seeks tenders from the private sector for designing, building, financing and running projects to provide these services. The capital costs are borne by the private sector, but then, if the provision of the service is not self-financing, the public sector pays the private firm for providing it. Thus, instead of the public sector being an owner of assets and provider or services, it is merely an enabler, buying services from the private sector. The system is known as a Public Private Partnership.

Clearly, there are immediate benefits to the public finances from using private, rather than public, funds to finance a project. Later, however, there is potentially an extra burden of having to buy the services from the private provider at a price that includes an element for profit. What is hoped is that the costs to the taxpayer of these profits will be more than offset by gains in efficiency.
Critics, however, claim that PFI projects have resulted in poorer quality of provision and that cost control has often been inadequate, resulting in a higher burden for the taxpayer in the long term. What is more, many of the projects have turned out to be highly profitable, suggesting that the terms of the original contracts were too lax.
There was some modification to the PFI process in 2012 with the launching of the government’s modified PFI scheme, dubbed PF2. Most of the changes were relatively minor, but the government would act as a minority public equity co-investor in PF2 projects, with the public sector taking stakes of up to 49 per cent in individual private finance projects and appointing a director to the boards of each project. This, it was hoped, would give the government greater oversight of projects.
With the demise of Carillion, there has been considerable debate over outsourcing by the government to the private sector and of PFI in particular. Is PFI the best model for funding public-sector investment and the running of services in the public sector?

On 18 January 2018, the National Audit Office published an assessment of PFI and PF2. The report stated that there are currently 716 PFI and PF2 projects either under construction or in operation, with a total capital value of £59.4 billion. In recent years, however, ‘the government’s use of the PFI and PF2 models has slowed significantly, reducing from, on average, 55 deals each year in the five years to 2007-08 to only one in 2016-17.’
Should the government have closer oversight of private providers? The government has been criticised for not heeding profit warnings by Carillion and continuing to award it contracts.
Should the whole system of outsourcing and PFI be rethought? Should more construction and services be brought ‘in-house’ and directly provided by the public-sector organisation, or at least managed directly by it with a direct relationship with private-sector providers? The articles below consider these issues.
Articles
Carillion collapse: How can one of the Government’s biggest contractors go bust? Independent, Ben Chu (15/1/18)
The main unanswered questions raised by Carillion’s collapse The Telegraph, Jon Yeomans (15/1/18)
Carillion taskforce to help small firms hit by outsourcer’s collapse The Telegraph, Rhiannon Curry (18/1/18)
Carillion Q&A: The consequences of collapse and what the government should do next The Conversation, John Colley (17/1/18)
UK finance watchdog exposes lost PFI billions Financial Times, Henry Mance and George Parker (17/1/18)
PFI not ‘fit for purpose’, says UK provider Financial Times, Gill Plimmer and Jonathan Ford (6/11/17)
Revealed: The £200bn Cost Of ‘Wasteful’ PFI Contracts Huffington Post, George Bowden (18/1/18)
U.K. Spends $14 Billion Per Year on Carillion-Style Projects Bloomberg, Alex Morales (18/1/18)
Carillion may have gone bust, but outsourcing is a powerful public good The Guardian, John McTernan (17/1/18)
PFI deals ‘costing taxpayers billions’ BBC News (18/1/18)
Taxpayers will need to pay £200bn PFI bill, says Watchdog ITV News (18/1/18)
The PFI bosses fleeced us all. Now watch them walk away The Guardian, George Monbiot (16/1/18)
Carillion’s collapse shows that we need an urgent review of outsourcing The Guardian, David Walker (16/1/18)
Carillion collapse: What next for public services? LocalGov, Jos Creese (16/1/18)
Taxpayers to foot £200bn bill for PFI contracts – audit office The Guardian, Rajeev Syal (18/1/18)
Official publications
A new approach to public private partnerships HM Treasury (December 2012)
Private Finance Initiative and Private Finance 2 projects: 2016 summary data GOV.UK
PFI and PF2 National Audit Office (18/1/18)
Questions
- Why did Carillion go into liquidation? Could this have been foreseen?
- Identify the projects in which Carillion has been involved.
- What has the government proposed to deal with the problems created by Carillion’s liquidation?
- What are the advantages and disadvantages of the Private Finance Initiative?
- Why have the number and value of new PFI projects declined significantly in recent years?
- How might PFI projects be tightened up so as to retain the benefits and minimise the disadvantages of the system?
- Why have PFI cost reductions proved difficult to achieve? (See paragraphs 2.7 to 2.17 in the National Audit Office report.)
- How would you assess whether PFI deals represent value for money?
- What are the arguments for and against public-sector organisations providing services, such as cleaning and catering, directly themselves rather than outsourcing them to private-sector companies?
- Does outsourcing reduce risks for the public-sector organisation involved?


 On 8 February, the Bank of England issued a statement that was seen by many as a warning for earlier and speedier than previously anticipated increases in the UK base rate. Mark Carney, the governor of the Bank of England, referred in his statement to ‘recent forecasts’ which make it more likely that ‘monetary policy would need to be tightened somewhat earlier and by a somewhat greater extent over the forecast period than anticipated at the time of the November report’.
 These statements have coincided with a week of sharp corrections and turbulence in the world’s largest capital markets, as investors become increasingly conscious of the threat of rising inflation – and the possibility of tighter monetary policy.


