When you hear about China, it’s often regarding their huge population, their strong growth or their dominance in exports. But, when it comes to baby milk, China is certainly an importer – and a big one at that. For many new parents, getting the ‘real thing’ when it comes to baby formula is absolutely essential.
Chinese baby formula is feared by many new parents, due to the potential for it to contain hormones and dangerous chemicals. This has led them to go to great lengths to ensure they have sufficient supplies of imported baby formula, often only trusting it if it has been hand carried from overseas. However, such is the demand for this safe version of baby milk that the global response has been to place restrictions on it. Essentially, we are seeing a system of rationing emerging.

Hong Kong was the first government to limit the amount bought to two cans of formula per day, with the potential for a fine of over $64,000 and up to two years in prison for those who do not abide by the rules. The UK has now also responded with restrictions on the quantity that can be purchased and other countries may follow suit if the excess demand continues.
According to Sainsburys:
As a short-term measure, retailers including Sainsbury’s are limiting the amount of baby milk powder that people can buy. In this way we aim to ensure a constant supply for our customers and we therefore hope they won’t be inconvenienced.
The Chinese government has reacted to this and is aiming to restore confidence in the food industry, but as yet there has been little positive effect and until there are 100% guarantees of food safety the surge in demand for baby formula from abroad is likely to continue.
This policy of rationing is clearly not only going to affect Chinese parents looking to import baby formula, but is already having an impact on domestic residents. Parents living in the UK are feeling the rationing effects and are also being restricted in terms of how many cans of formula they can buy per day. For many families this isn’t a problem, but for those with multiple children and for whom a trip to the supermarket is not a simple task, the restrictions on baby milk purchases is likely to become a problem. The following articles consider this topic.
Baby milk rationing: Chinese fears spark global restrictions BBC News, Celia Hatton (10/4/13)
Stop rationing information about baby formula milk The Telegraph, Rosie Murray-West (9/4/13)
Baby milk rationed in UK over China export fear BBC News (8/4/13)
Baby Formula rationed in UK over China demand Sky News (9/4/13)
Supermarkets limit sales of baby milk to stop bulk buying to feed China market Independent, Emma Bamford (8/4/13)
Cahinese thirst for formula spurs rationing Financial Times, Amie Tsang and Louise Lucas (7/4/13)
Entrepreneurs milk Chinese thirst for formula Financial Times, Amie Tsang and Louise Lucas (7/4/13)
Baby milk powder rationing introduced by supermarkets The Guardian, Rebecca Smithers (8/4/13)
Questions
- Using a diagram of demand and supply, illustrate how a shortage for a product can emerge. How does the price mechanism usually work to eliminate a shortage?
- What actions can be taken to deal with a shortage?
- How will more stringent regulations by the Chinese government help to restore confidence in Chinese baby milk formula?
- What impact will the imports of baby milk formula into China have on China’s exchange rate and its balance of payments?
- How could this situation be taken advantage of by entrepreneurs? Could it be used as a viable business opportunity?
 Much has been written on Margaret Thatcher following her death at the age of 87 on April 8. But getting a calm assessment of both her time in office and her legacy is not easy. And it’s clear why: she created both stronger loyalty and stronger opposition than any other UK Prime Minister.
As economists, however, we should try to be as dispassionate as possible in assessing the effects of policies. There is always a normative question of the relative desirability of different economic outcomes – and you will have your own views on the relative importance of objectives such as economic growth, greater equality and greater social cohesion – but to determine cause and effect, or at least correlation, requires a careful examination of the evidence. Also, drawing lessons for future policy requires a careful modelling of the economy and the effects of changing economic variables.
The following articles have been selected from the hundreds that have appeared in the press in the past few days. Whilst they cannot be claimed to be totally ‘objective’, taken together they give a good overview of her economic policies and her economic legacy.
You may well have been surprised by the amount of coverage of her death and at the fervour of her supporters and critics. But this bears witness to the huge effect she had on both the political scene and on the UK economy – for good or bad.
Articles
Margaret Thatcher’s timeline: From Grantham to the House of Lords, via Arthur Scargill and the Falklands War Independent (8/4/13)
Overhauls Are Still Felt, Debated Decades Later Wall Street Journal, Charles Forelle (9/4/13)
Margaret Thatcher’s Four Ages of Monetary Policy EconoMonitor, David Smith (10/4/13)
How Mrs Thatcher smashed the Keynesian consensus The Economist (9/4/13)
Margaret Thatcher: The economy now and then BBC News, Stephanie Flanders (10/4/13)
Did Margaret Thatcher transform Britain’s economy for better or worse? The Guardian, Larry Elliott (8/4/13)
A look back at Margaret Thatcher’s economic record Washington Post, Dylan Matthews (8/4/13)
Margaret Thatcher’s legacy for business and economics—the world weighs in Quartz, Gwynn Guilford (8/4/13)
Data
Economic Data freely available online The Economics Network, see especially sites 1, 2, 3, 6 and 9
Questions
- Summarise the macroeconomic policies followed by the Thatcher government from 1979 to 1990.
- Chart economic growth, unemployment and inflation over Margaret Thatcher’s time in office. How does the performance of each of these indicators compare with the period from 1990 to 2007 and from 2008 to the present day?
- What is meant by ‘monetarism’? Did the Thatcher government follow pure monetarist policies?
- What is meant by the ‘Big Bang’ as applied to the financial sector in 1986? Assess the long-term consequences of the Big Bang.
- What elements of ‘Thatcherism’ were retained by the Labour government from 1997 to 2010?
- To what extent can the current Coalition government be described as ‘Thatcherite’?
 The UK economy faces a growing problem of energy supplies as energy demand continues to rise and as old power stations come to the end of their lives. In fact some 10% of the UK’s electricity generation capacity will be shut down this month.
Energy prices have risen substantially over the past few years and are set to rise further. Partly this is the result of rising global gas prices.
In 2012, the response to soaring gas prices was to cut gas’s share of generation from 39.9% per cent to 27.5%. Coal’s share of generation increased from 29.5% to 39.3%, its highest share since 1996 (see The Department of Energy and Climate Change’s Energy trends section 5: electricity). But with old coal-fired power stations closing down and with the need to produce a greater proportion of energy from renewables, this trend cannot continue.
 But new renewable sources, such as wind and solar, take a time to construct. New nuclear takes much longer (see the News Item, Going nuclear). And electricity from these low-carbon sources, after taking construction costs into account, is much more expensive to produce than electricity from coal-fired power stations.
So how will the change in balance between demand and supply affect prices and the security of supply in the coming years. Will we all have to get used to paying much more for electricity? Do we increasingly run the risk of the lights going out? The following video explores these issues.
Webcast
UK may face power shortages as 10% of energy supply is shut down BBC News, Joe Lynam (4/4/13)
Data
Electricity Statistics Department of Energy & Climate Change
Quarterly energy prices Department of Energy & Climate Change
Questions
- What factors have led to a rise in electricity prices over the past few years? Distinguish between demand-side and supply-side factors and illustrate your arguments with a diagram.
- Are there likely to be power cuts in the coming years as a result of demand exceeding supply?
- What determines the price elasticity of demand for electricity?
- What measures can governments adopt to influence the demand for electricity? Will these affect the position and/or slope of the demand curve?
- Why have electricity prices fallen in the USA? Could the UK experience falling electricity prices for similar reasons in a few years’ time?
- In what ways could the government take into account the externalities from power generation and consumption in its policies towards the energy sector?
 The English Premier League (EPL) has negotiated a record TV deal which will generate £5.5 billion of revenue over the next 3 years – beginning in the season 2013–14. This represents a 70% increase on the previous deal. Controversy has arisen over some initial proposals put forward by the EPL as to how the money will be spent. The owners of the clubs in the Championship of the English Football League (EFL) are particularly concerned about the size of the proposed payments to the three teams relegated from the EPL.
Some 30 years ago the money generated from the sale of television rights was equally shared between all the teams in the then four divisions of the English Football League (EFL). In 1992 the top division of the English Football League broke away and formed the English Premier League (EPL). This newly formed EPL negotiated a separate television deal and kept the majority of the money. However, some payments were and still are made to the teams in the EFL and to organisations such as the League Managers Association and Professional Footballers Association. For example in 2011-–12 the EPL donated £189.4 million of the £1.2 billion generated from that year’s TV deal.
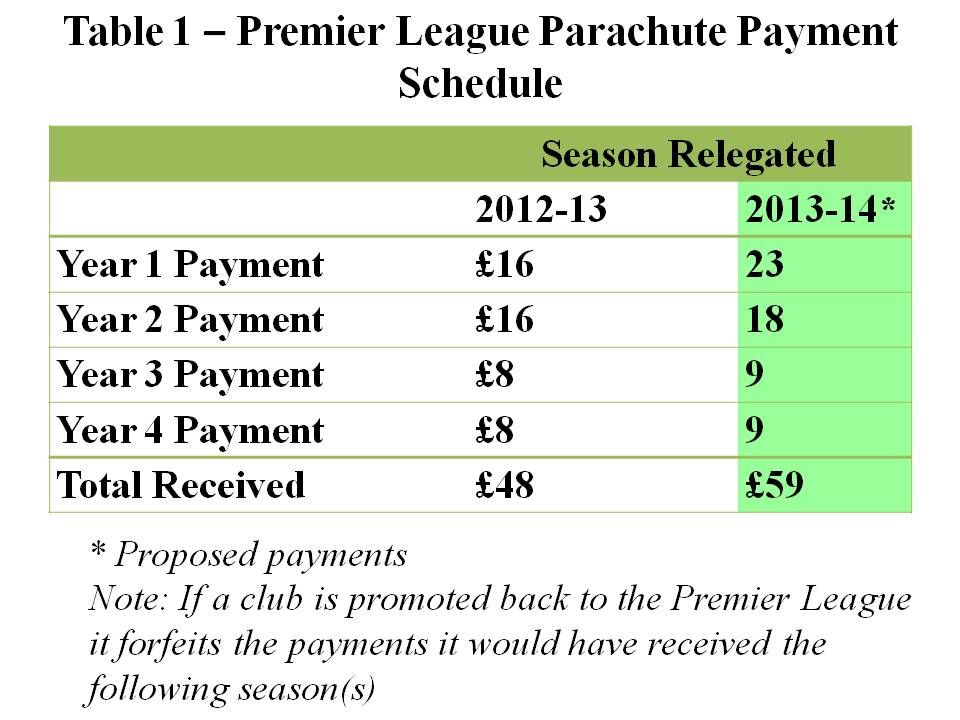
The majority of the money donated by the EPL is spent in two main ways. First, some money is redistributed to all the teams in the EFL: i.e. The Championship, League 1 and League 2. These are known as ‘solidarity payments’ and in 2011–12 the EPL spent £49.8 million on this scheme. Each club in the Championship received £2.3 million. It has been proposed that the amount paid into this scheme should be increased by 5% in the season 2013–14. Second, a relatively large amount of money is paid over a four-year period to the three teams relegated each season from the EPL into the Championship. These are known as ‘parachute payments’ and in the season 2011–12 the EPL spent £90.9 million on this scheme. The rationale for having parachute payments is to help the relegated teams adjust their wage bills to the much lower revenue streams that come from playing in the Championship. Proposed changes to the scheme are outlined in Table 1.
 The chairmen of the football league clubs met on the 20th March 2013 and a number of them expressed concerns about the relatively large increase in the parachute payments compared to the solidarity payments. They were particularly concerned that the changes to the funding would damage the competitive balance of the Championship.
Competitive balance refers to how the most talented players are distributed amongst the teams in a league. For example, are the majority of the most talented footballers playing for just a couple of the teams? In this case the league is competitively imbalanced and the teams with the best players will tend to win far more games than the other teams. The outcome of the league will be very predictable. If the most talented players were more evenly spread across all the teams in the league, then it would be more competitively balanced. Matches and the outcome of the league would become more unpredictable.
Does the level of competitive balance matter? Some sports economists have argued that it may have a significant impact on the success of the league. This is because fans may value the unpredictability of the results. It follows that closer and more unpredictable results will generate higher match-day attendances and increase the revenues of the clubs.
This is an interesting argument and is the opposite of what economic theory would predict for most markets. For example, the standard prediction would be that as firms outperform their rivals, they generate more revenue and profit. If they manage to drive all their rivals out of business, they would become a pure monopoly and make large abnormal profits. However in professional team sports the outcome may differ significantly. If the unpredictability of the league is highly valued by fans, then teams will generate more revenue when they have strong and evenly matched rivals.
It has been reported that further discussions about the distribution of the money will take place this month with the owners of the championship clubs arguing that there should be smaller increases in parachute payments and much larger increases in solidarity payments. Representatives of the EPL have argued that the parachute payments do not distort competition and make the championship predictable. They point out that at present only one of the top six teams in the championship (Hull) receives parachute payments, while only one of the teams promoted from the Championship in the season 2012–13 (West Ham) received these payments.
Articles
Premier League warned over rich and poor split in wake of TV deal The Guardian, Owen Gibson (19/3/13)
Championship clubs angered by Premier League parachute boost Daily Mail, Charles Sale (6/2/13)
Football league is to lessen the advantage of parachute payments The Guardian, Owen Gibson (20/3/13)
Championship clubs warn Premier League over hike in parachute payments for relegated teams The Independent, Majid Mohamed (20/3/13)
Increased parachute payments could lead to a salary cap in the Championship The Post, A. Stockhausen (21/3/13)
Scudamore:Parachute payment system fair Eurosport, Andy Eckardt (22/3/13)
Parachute payments more than a softened landing The Daisy Cutter, Richard Brook (21/3/13)
Questions
- What factors will influence the size of the attendance at a football match?
- To what extent do you think that the money generated from the sale of television rights should be equally shared between all the clubs in the English Premier League and the English Football League
- Can you think of any ways of measuring the competitive balance of a football league?
- Explain why a very competitively imbalanced league may reduce the revenue for all the clubs in that league?.
- In traditional economic theory it is assumed that firms aim to maximise their profits. What do you think is the objective of a typical football club in the English Premier League?
 In the blog No accounting for trade, the rise in the UK’s balance of trade deficit was discussed. Many factors have contributed to this weakening position and no one market is to blame. But, by analysing one product and thinking about the factors that have caused its export volumes to decline, we can begin to create a picture not just of the UK economy (or more particularly Scotland!), but of the wider global economy.
Scotch whisky may not have been the drink of choice for many British adults, but look outside Great Britain and the volume consumed is quite staggering. For example, French consumers drink more Scotch whisky in one month than they drink cognac in one year. The volume of Scotch whisky exported from our shores was £4.23 billion for 2011, accounting for 90% of all sales and making its way into 200 markets. However, one problem with this product is that it is highly susceptible to the business cycle. Add to this the time required to produce the perfect Scotch (in particular the fact that it must be left to mature) and we have a market where forecasting is a nightmare.
Producers typically look to forecast demand some 10 years ahead and so getting it right is not always easy, especially when the global economy declines following a financial crisis! So what has been the impact on exports of this luxurious drink? In the past few years, it has been as key growth market for UK exports rising by 190% in value over the past decade. But in 2012 the volume of Scotch whisky exports fell by 5% to 1.19 billion bottles. What explains the decline in sales?
The biggest importer of Scotch whisky is France and its volumes were down by 25%. Part of this decline is undoubtedly the economic situation. When incomes decline, demand for normal goods also falls. Many would suggest Scotch whisky is a luxury and thus we would expect to see a relatively large decline following any given fall in income. However, another factor adding to this decline in 2012 is the increased whisky tax imposed by the French government. Rising by 15% in 2012, commentators suggest that this caused imports of Scotch whisky to rise in 2011 to avoid this tax, thus imports in 2012 took a dive. Spain is another key export market and its economic troubles are clearly a crucial factor in explaining their 20% drop in volume of Scotch whisky imported.
But, it’s not all bad news: sales to Western Europe may be down, but Eastern Europe and other growth countries/continents, such as the BRICs and Africa have developed a taste for this iconic product. Latvia and Estonia’s value of Scotch whisky imports were up by 48% and 28% respectively, as Russian demand rises and China, still growing, is another key market. Gavin Hewitt, chief executive of the Scotch Whisky Association said:
A combination of successful trade negotations, excellent marketing by producers, growing demand from mature markets, particularly the USA, and the growing middle class in emerging economies helped exports hit a record £4.3bn last year.
Furthermore, while the volume of exports worldwide did fall, the value of these exports rose to £4.27 billion, a growth of 1%. This suggests that although we are exporting fewer bottles, the bottles that we are exporting are more expensive ones. Clearly some people have not felt the impact of the recession. For Scotland and the wider UK, these declining figures are concerning, but given the cyclical nature of the demand, as the world economy slowly begins to recover, sales are likely to follow suit. Gavin Hewitt continued his comments above, saying:
We are contributing massively to the Government’s wish for an export-led recovery. There is confidence in the future of the industry, illustrated by the £2bn capital investment that Scotch whisky producers have committed over the next three to four years.
The following articles consider the rise and fall of this drink and its role as a key export market across the world.
 Scottish whisky industry puts export hope in new market BBC News (2/4/13)
Scotch whisky sales on the slide The Guardian, Simon Neville (2/4/13)
Growth stalls for Scotch whisky exports BBC News (2/4/13)
Scotch whisky accounts for 25pc of UK’s food and drink exports The Telegraph, Auslan Cramb (2/4/13)
Whisky sales fall but value of exports hits new high Herald Scotland (3/4/13)
Scotch whisky exports rise to record value The Telegraph, Auslan Cramb (2/4/13)
Scotch whisky exports hit by falling demand in France The Grocer, Vince Bamford (2/4/13)
New markets save Scotch from impact of austerity Independent, Tom Bawden (2/4/13)
Scotch exports hit by falling demand Financial Times, Hannah Kichler (2/4/13)
Questions
- Which is the better measure of an industry’s performance: the value or the volume of goods sold?
- Why would you expect volumes of Scotch sold to decline during an economic downturn?
- When a higher tax was imposed on Scotch whisky in France, why did volumes fall? Use a demand and supply diagram to illustrate the impact of the tax.
- What type of figure would you expect Scotch whisky to have for income elasticity of demand? Does it vary for different people?
- Why is forecasting demand for Scotch so difficult? What techniques might be used?
- Why does demand for Scotch whisky remain high and even rising in many emerging markets?
- Is the market for Scotch whisky exports a good indication of the interdependence of countries across the world?