The New Year is a time for reflection and prediction. What will the New Year bring? What does the longer-term future hold? Here are two articles from The Guardian that look into the future.
The first, by Larry Elliott, considers a number of scenarios and policy options. Although not totally doom laden, the article is not exactly cheery in its predictions. Perhaps ‘life will go on’ and the global economy will muddle through. But perhaps a new recession is around the corner or, even worse, the world is at a tipping point when things are fundamentally changing. Unless policy-makers are careful, clever and co-ordinated, perhaps a new dark age may be looming. But who knows?
Which brings us to the second article, by Gaby Hinsliff. This argues that people are pretty hopeless at predicting. “History is littered with supposed dead certs that didn’t happen – Greece leaving the euro, the premature collapse of the coalition – and wholly unimagined events that came to pass.” And economists and financial experts are little better.
Two years ago, The Observer challenged a panel of City investors to pick a portfolio of stocks and rated their performance against that of Orlando, a ginger cat who selected his portfolio by tossing a toy mouse at a sheet of paper. Inevitably, the cat triumphed.
But is this fair? If capital markets are relatively efficient, stock prices today already reflect knowable information about the future, but clearly not unknowable information.
It’s the same with economies. When information is already to hand, such as a pre-announced tax change, then its effects, ceteris paribus, can be estimated – at least roughly.
 But it’s the ‘ceteris paribus‘ assumption that’s the problem. Other things are not equal. The world is constantly changing and there are all sorts of unpredictable events that will influence the outcomes of economic policy and of economic decisions more generally. And central to the problem are people’s attitudes and confidence. Mood can swing quite dramatically, from irrational exuberance to deep pessimism. And such mood changes – often triggered by some exogenous factor, such as an international dispute, an election or unexpected economic news – can rapidly gather momentum and have significant effects.
Predicting the long-term future is both easier and more difficult: easier, in that short-term cyclical effects are less relevant; more difficult in that changes that have not yet happened, such as technological changes or changes in working practices, may themselves be key determinants of the future global economy.
One of the most salutary lessons is to look at predictions made in the past about the world today and at just how wrong they have proved to be. Perhaps we need to call on Orlando more frequently.
Why ‘life will go on’ thesis about global economy might not pass muster in 2015 The Guardian, Larry Elliott (28/12/14)
Who knows what the new year holds? Certainly none of us The Guardian, Gaby Hinsliff (26/12/14)
Questions
- Give some examples of factors that could have a major influence on the global economy, but which are unpredictable.
- Is economic forecasting still worthwhile? Explain.
- Look at some macroeconomic forecasts made in the past about the world today. You might want to look at forecasts of agencies such as the IMF, the OECD, the World Bank and the European Commission. You can find links in the Economics Network’s Economic Data freely available online. Explain why such forecasts have differed from the actual outcome.
- Why, if capital markets were perfect, might Orlando be just as good as a top investment manager at predicting the future course of share prices?
- In what ways is economic forecasting similar to and different from weather forecasting in its methods, its use of data and its reliability?
 As we saw in Part 1 of this blog, oil prices have fallen by some 46% in the past five months. In that blog we looked at the implications for fuel prices. Here we look at the broader implications for the global economy? Is it good or bad news – or both?
First we’ll look at the oil-importing countries. To some extent the lower oil price is a reflection of weak global demand as many countries still struggle to recover from recession. If the lower price boosts demand, this may then cause the oil price to rise again. At first sight, this might seem merely to return the world economy to the position before the oil price started falling: a leftward shift in the demand for oil curve, followed by a rightward shift back to where it was. However, the boost to demand in the short term may act as a ‘pump primer’.  The higher aggregate demand may result in a multiplier effect and cause a sustained increase in output, especially if it stimulates a rise in investment through rising confidence and the accelerator, and thereby increases capacity and hence potential GDP.
But the fall in the oil price is only partly the result of weak demand. It is mainly the result of increased supply as new sources of oil come on stream, and especially shale oil from the USA. Given that OPEC has stated that it will not cut its production, even if the crude price falls to $40 per barrel, the effect has been a shift in the oil supply curve to the right that will remain for some time.
So even if the leftward shift in demand is soon reversed so that there is then some rise in oil prices again, it is unlikely that prices will rise back to where they were. Perhaps, as the diagram illustrates, the price will rise to around $70 per barrel. It could be higher if world demand grows very rapidly, or if some sources of supply go off stream because at such prices they are unprofitable.
The effect on oil exporting countries has been negative. The most extreme case is Russia, where for each $10 fall in the price of oil, its growth rate falls by around 1.4 percentage points (see). Although the overall effect on global growth is still likely to be positive, the lower oil price could lead to a significant cut in investment in new oil wells. North sea producers are predicting a substantial cut in investment. Even shale oil producers in the USA, where the marginal cost of extracting oil from existing sources is only around $10 to £20 per barrel, need a price of around $70 or more to make investment in new sources profitable. What is more, typical shale wells have a life of only two or three years and so lack of investment would relatively quickly lead to shale oil production drying up.
The implication of this is that although there has been a rightward shift in the short-run supply curve, if price remains low the curve could shift back again, meaning that the long-run supply curve is much more elastic. This could push prices back up towards $100 if global demand continues to expand.
 This can be illustrated in the diagram. The starting point is mid-2014. Global demand and supply are D1 and S1; price is $112 per barrel and output is Q1. Demand now shifts to the left and supply to the right to D2 and S2 respectively. Price falls to $60 per barrel and, given the bigger shift in supply than demand, output rises to Q2. At $60 per barrel, however, output of Q2 cannot be sustained. Thus at $60, long-run supply (shown by SL) is only Q4.
But assuming the global economy grows over the coming months, demand shifts to the right: say, to D3. Assume that it pushes price up to $100 per barrel. This gives a short-run output of Q3, but at that price it is likely that supply will be sustainable in the long run as it makes investment sufficiently profitable. Thus curve D3 intersects with both S2 and SL at this price and quantity.
The articles below look at the gainers and losers and at the longer-term effects.
Articles
Where will the oil price settle? BBC News, Robert Peston (22/12/14)
Falling oil prices: Who are the winners and losers? BBC News, Tim Bowler (16/12/14)
Why the oil price is falling The Economist (8/12/14)
The new economics of oil: Sheikhs v shale The Economist (6/12/14)
Shale oil: In a bind The Economist (6/12/14)
Falling Oil Price slows US Fracking Oil-price.net, Steve Austin (8/12/14)
Oil Price Drop Highlights Need for Diversity in Gulf Economies IMF Survey (23/12/14)
Lower oil prices boosting global economy: IMF Argus Media (23/12/14)
Collapse in oil prices: producers howl, consumers cheer, economists fret The Guardian (16/12/14)
North Sea oilfields ‘near collapse’ after price nosedive The Telegraph, Andrew Critchlow (18/12/14)
How oil price fall will affect crude exporters – and the rest of us The Observer, Phillip Inman (21/12/14)
Cheaper oil could damage renewable energies, says Richard Branson The Guardian,
Richard Branson: ‘Governments are going to have to think hard how to adapt to low oil prices.’ John Vidal (16/12/14)
Data
Brent crude prices U.S. Energy Information Administration (select daily, weekly, monthly or annual data and then download to Excel)
Brent Oil Historical Data Investing.com (select daily, weekly, or monthly data and time period)
Questions
- What would determine the size of the global multiplier effect from the cut in oil prices?
- Where is the oil price likely to settle in (a) six months’ time; (b) two years’ time? What factors are you taking into account in deciding your answer?
- Why, if the average cost of producing oil from a given well is $70, might it still be worth pumping oil and selling it at a price of $30?
- How does speculation affect oil prices?
- Why has OPEC decided not to cut oil production even though this is likely to drive the price lower?
- With Brent crude at around $60 per barrel, what should North Sea oil producers do?
- If falling oil prices lead some oil-importing countries into deflation, what will be the likely macroeconomic impacts?
 Oil prices have been plummeting in recent months. Indeed, many commentators are saying that this is the major economics news story of 2014. In June 2014 Brent crude was around $112 per barrel. By December the price has fallen to around $60 – a fall of 46%. But what are the implications for fuel prices?
Just because the crude oil price has fallen by 46%, this does not mean that prices at the pump should do the same. Oil is priced in dollars and the pound has depreciated against the dollar by just over 7% since June, from around £1 = $1.69 to around £1 = $1.57. Thus in sterling terms, crude oil has fallen by only 42%.
More significantly, the cost of crude is a relatively small percentage of the price of a litre of petrol. At a price of 132p per litre (the July average price), crude accounted for around 27% of the price, or around 36p per litre. At a price of 114p per litre, the price in late December, crude accounts for around 19% of the price, or around 21.5p per litre. The largest element of price is fuel duty, which is charged at a flat rate of 57.95p per litre. In addition there is VAT at 20% of the pre-VAT price (or 16.67% of the retail price). Finally there are the refining, distribution and retail costs and margins, but these together account for only around 16p per litre.
 What this means is that the 46% cut in oil prices has led to a cut in petrol prices of only around 14%. If petrol prices were to reach £1 per litre, as some commentators have forecast, crude oil prices would have to fall to under $40 per barrel.
Although petrol and diesel prices have fallen by a smaller percentage than oil prices, this still represents a significant cut in motoring and transport costs. It also represents a significant cut in costs for the petrochemical industry and other industries using large amounts of oil.
For oil-importing countries this is good news as the fall in the oil price represents an increase in real incomes. For oil importing countries, and especially those such as Russia and some OPEC countries where oil constitutes a large proportion of their exports, it is bad news. We explore these effects in Part 2.
Videos
 UK petrol prices hit four-year low BBC News, John Moyland (10/12/14)
Petrol prices plunge ahead of Christmas holidays Belfast Telegraph (19/12/14)
Petrol price plummet – could fuel drop to below a pound a litre in the New Year? Channel 5 News on YouTube (17/12/14)
Articles
UK motorists benefit from petrol price drop Financial Times, Michael Kavanagh (23/12/14)
Petrol to drop to £1 a litre, says Goldman Sachs The Telegraph, Szu Ping Chan (9/12/14)
Oil prices: How low will they go in 2015? International Business Times, Shane Croucher (22/12/14)
Plummeting oil price may lead to petrol falling below £1 a litre RAC news (17/12/14)
Pump Prices: Cheap Petrol Comes With A Warning Sky News (19/12/14)
Data and information
Fuel prices in Europe Drive Alive (20/12/14)
Weekly road fuel prices Department of Energy & Climate Change (23/12/14)
Prices at the pump – why are they falling and will this continue? ONS (18/12/14)
Fuel Prices Explained RAC
UKPIA Statistical Review 2014 United Kingdom Petroleum Industry Association
Questions
- Why does the price of petrol fluctuate less in percentage terms than the price of crude oil?
- What factors will affect whether UK petrol prices fall to £1 per litre?
- If crude oil prices fell by 20%, in which of these two cases would there be a bigger percentage fall in petrol prices: (a) petrol price currently 140p; (b) petrol price currently 110p? Explain.
- Distinguish between a specific tax and an ad valorem tax. Which of these is (a) fuel duty; (b) VAT? Illustrate your answer with a supply and demand diagram.
- What determines the price elasticity of demand for petrol and diesel? Is the long-run elasticity likely to be higher or lower than the short-run elasticity? Explain.
- Distinguish between demand-pull and cost-push inflation. Given that oil price changes are correlated to inflation, would you characterise recent falls in inflation as reductions in demand-pull or cost-push pressures, or both: (a) in a specific oil-importing country; (b) globally?
 Since the Global Financial Crisis, and especially since 2010, there has been a significant decline in the volume of commercial freight carried by aircraft. Whilst regional and national economies have been hit by fiscal problems, credit snarl-ups and twitchy consumer demand, increases in the price of crude oil (until recently) have compounded air freight cost increases, leading to substitution towards the main alternatives.
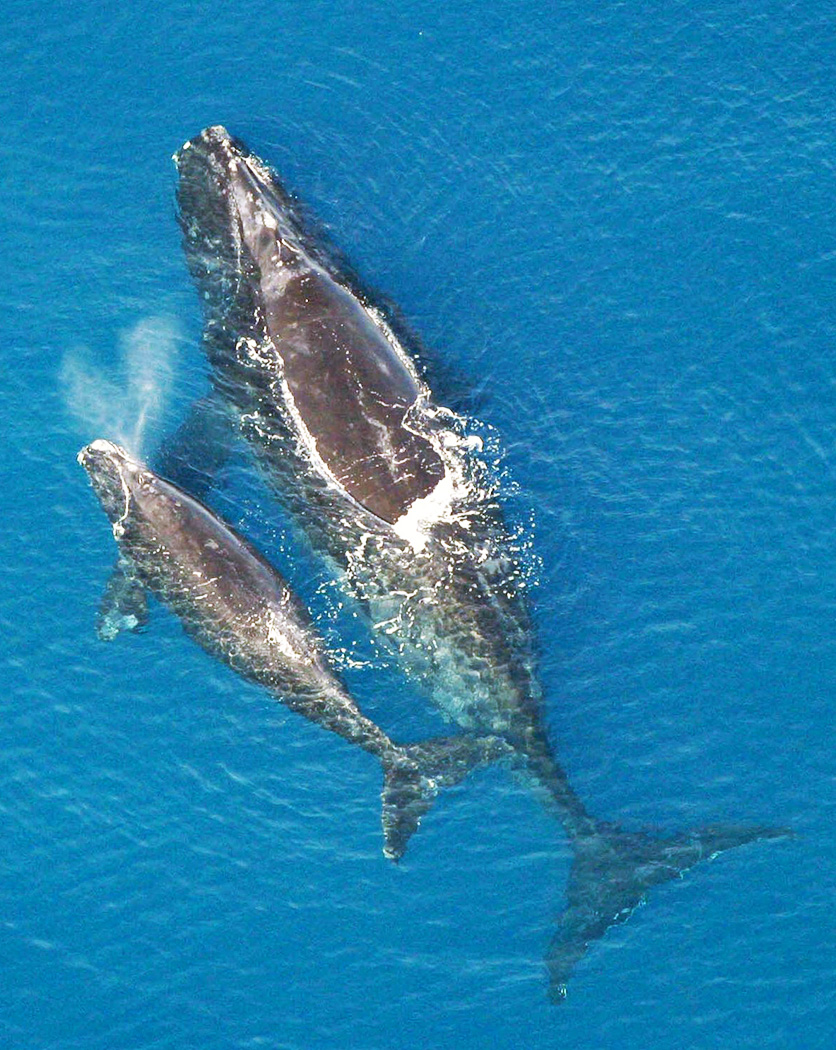
Whilst some multinational businesses have shifted production back ‘on-shore’, there has been unprecedented growth in sea freight. In the latter case there are, of course, both ‘winners’ and ‘losers’. As the world’s seas and oceans become more and more congested, one of the distinct losers is a large species which shares the water with commercial maritime transport: the whale.
A recent ‘Sharing the Planet’ documentary on BBC Radio 4, highlighted the plight of whales in the world’s open waters. Since the imposition of controls upon the whaling industry, whale numbers had stabilised and even increased. However, the past five years has seen the most significant threat coming from the eerily clinical-sounding ‘ship strike’: that is, unintended incidents of ships hitting and either injuring or killing whales. In particular, the Blue Whale and the Right Whale have been most affected – the Right Whale was almost driven to extinction by ship strikes in the North Atlantic region.
International action is driving a regulatory approach which aims to intervene, for example, to impose speed restrictions in known waters where whales congregate. But this isn’t a universal solution. Even where it is applied, enforcement is tricky and there is industry resistance as already slow shipping freight delivery times are further extended, thus challenging producers under pressure to respond rapidly to changing consumer demand in the world of ecommerce.
But where is the link to the movie Frozen? Well, this year’s top-selling range of toys are tie-ins to Disney’s wintery animated blockbuster. Excess demand for some of the tie-in merchandising has led to  short supply in toy stores and carefully planned production and shipping plans junked. Panicked creation of extra capacity in off-shore production has had to be complemented by the contracting of air freighting options – the lead times are too long to get last-minute products to distributors and retailers in time. Whilst someone has to bear the increased financial cost, the whale might therefore become – at least temporarily – a beneficiary.
But the message is clear: globalised production and distribution involve a complex web of trade-offs.  Where negative externalities hit those without a global voice, this adds weight to the continued efforts towards sustainability and the full costing of production and exchange. Whales are a ‘flagship species’ in diverse ecological systems. The planet cannot afford to lose them. And so, whilst your gift purchases this festive season may have been made possible by products having been air-freighted rather than being sent by yet another ship, don't rest on your laurels. Consider this variant on a traditional injunction: whales are for life, and not just for Christmas.
Guest post by Simon Blake, University of Warwick
Books and articles
Nature in the Balance: The Economics of Biodiversity Oxford Dieter Helm and Cameron Hepburn (eds) (2014)
Frozen dolls sell out Express Sarah Ann Harris (9/12/14)
Biodiversity Finance and Economics Tread Softly November 2014
Information
EU Business and Biodiversity Platform EC Environment DG
Whales & Dolphins (cetaceans) World Wildlife Fund
Questions
- Why might UK-based businesses be concerned with the plight of whales in the world’s seas and oceans?
- In what ways might shipping firms – and the manufacturers who contract their services – be regarded as ‘good’ businesses?
- Using the concept of externalities, how would you account for the impacts of global commerce upon whales?
- How could you conduct a scientific evaluation of the trade-offs involved?
- Can damage to one species by the actions of business ever be offset by ‘making good’ through corporate action elsewhere?
 What is the relationship between the degree of inequality in a country and the rate of economic growth? The traditional answer is that there is a trade off between the two. Increasing the rewards to those who are more productive or who invest encourages a growth in productivity and capital investment, which, in turn, leads to faster economic growth. Redistribution from the rich to the poor, by contrast, is argued to reduce incentives by reducing the rewards from harder work, education, training and investment. Risk taking, it is claimed, is discouraged.
Recent evidence from the OECD and the IMF, however, suggests that when income inequality rises, economic growth falls. Inequality has grown massively in many countries, with average incomes at the top of the distribution seeing particular gains, while many at the bottom have experienced actual declines in real incomes or, at best, little or no growth.  This growth in inequality can be seen in a rise in countries’ Gini coefficients. The OECD average Gini coefficient rose from 0.29 in the mid-1980s to 0.32 in 2011/12. This, claims the OECD, has led to a loss in economic growth of around 0.35 percentage points per year.
But why should a rise in inequality lead to lower economic growth? According to the OECD, the main reason is that inequality reduces the development of skills of the lower income groups and reduces social mobility.
By hindering human capital accumulation, income inequality undermines education opportunities for disadvantaged individuals, lowering social mobility and hampering skills development.
The lower educational attainment applies both to the length and quality of education: people from poorer backgrounds on average leave school or college earlier and with lower qualifications.
But if greater inequality generally results in lower economic growth, will a redistribution from rich to poor necessarily result in faster economic growth? According to the OECD:
Anti-poverty programmes will not be enough. Not only cash transfers but also increasing access to public services, such as high-quality education, training and healthcare, constitute long-term social investment to create greater equality of opportunities in the long run.
Thus redistribution policies need to be well designed and implemented and focus on raising incomes of the poor through increased opportunities to increase their productivity. Simple transfers from rich to poor via the tax and benefits system may, in fact, undermine economic growth. According to the IMF:
That equality seems to drive higher and more sustainable growth does not in itself support efforts to redistribute. In particular, inequality may impede growth at least in part because it calls forth efforts to redistribute that themselves undercut growth. In such a situation, even if inequality is bad for growth, taxes and transfers may be precisely the wrong remedy.
Articles
Inequality ‘significantly’ curbs economic growth – OECD BBC News (9/12/14)
Is inequality the enemy of growth? BBC News, Robert Peston (6/10/14)
Income inequality damages growth, OECD warns Financial Times, Chris Giles (8/10/14)
OECD finds increasing inequality lowers growth Deutsche Welle, Jasper Sky (10/12/14)
Revealed: how the wealth gap holds back economic growth The Guardian, Larry Elliott (9/12/14)
Inequality Seriously Damages Growth, IMF Seminar Hears IMF Survey Magazine (12/4/14)
Warning! Inequality May Be Hazardous to Your Growth iMFdirect, Andrew G. Berg and Jonathan D. Ostry (8/4/11)
Economic growth more likely when wealth distributed to poor instead of rich The Guardian, Stephen Koukoulas (4/6/15)
So much for trickle down: only bold reforms will tackle inequality The Guardian, Larry Elliott (21/6/15)
Videos
Record inequality between rich and poor OECD on YouTube (5/12/11)
The Price of Inequality The News School on YouTube, Joseph Stiglitz (5/10/12)
Reports and papers
FOCUS on Inequality and Growth OECD, Directorate for Employment, Labour and Social Affairs (December 2014)
Trends in Income Inequality and its Impact on Economic Growth OECD Social, Employment and Migration Working Papers, Federico Cingano (9/12/14)
An Overview of Growing Income Inequalities in OECD Countries: Main Findings OCED (2011)
Redistribution, Inequality, and Growth IMF Staff Discussion Note, Jonathan D. Ostry, Andrew Berg, and Charalambos G. Tsangarides (February 2014)
Measure to Measure Finance and Development, IMF, Jonathan D. Ostry and Andrew G. Berg (Vol. 51, No. 3, September 2014)
Data
OECD Income Distribution Database: Gini, poverty, income, Methods and Concepts OECD
The effects of taxes and benefits on household income ONS
Questions
- Explain what are meant by a Lorenz curve and a Gini coefficient? What is the relationship between the two?
- The Gini coefficient is one way of measuring inequality. What other methods are there? How suitable are they?
- Assume that the government raises taxes to finance higher benefits to the poor. Identify the income and substitution effects of the tax increases and whether the effects are to encourage or discourage work (or investment).
- Distinguish between (a) progressive, (b) regressive and (c) proportional taxes?
- How will the balance of income and substitution effects vary in each of the following cases: (a) a cut in the tax-free allowance; (b) a rise in the basic rate of income tax; (c) a rise in the top rate of income tax? How does the relative size of the two effects depend, in each case, on a person’s current income?
- Identify policy measures that would increase both equality and economic growth.
- Would a shift from direct to indirect taxes tend to increase or decrease inequality? Explain.
- By examining Tables 3, 26 and 27 in The Effects of Taxes and Benefits on Household Income, 2012/13, (a) explain the difference between original income, gross income, disposable income and post-tax income; (b) explain the differences between the Gini coefficients for each of these four categories of income in the UK.


 But it’s the ‘ceteris paribus‘ assumption that’s the problem. Other things are not equal. The world is constantly changing and there are all sorts of unpredictable events that will influence the outcomes of economic policy and of economic decisions more generally. And central to the problem are people’s attitudes and confidence. Mood can swing quite dramatically, from irrational exuberance to deep pessimism. And such mood changes – often triggered by some exogenous factor, such as an international dispute, an election or unexpected economic news – can rapidly gather momentum and have significant effects.