 Over 90% of UK households buy their gas and electricity from one of the ‘big six’ energy suppliers – British Gas (Centrica), EDF, E.ON, npower (RWE), Scottish Power (Iberdrola) and SSE. The big six are currently being investigated by the Competition and Markets Authority (CMA) for possible breach of a dominant market position.
An updated ‘issues statement‘ summarises the investigation group’s initial thinking based on the evidence it has received. In paragraph 16 it states:
Comparing all available domestic tariffs – including those offered by the independent suppliers – we calculate that, over the period Quarter 1 2012 to Quarter 2 2014, over 95% of the dual fuel customers of the Six Large Energy Firms could have saved by switching tariff and/or supplier and that the average saving available to these customers was between £158 and £234 a year (depending on the supplier).
 Between 40% and 50% of customers have been with a supplier for more than 10 years. The companies are thus accused of exploiting these ‘loyalty’ customers, many of whom are too busy or ill-informed to switch to an alternative supplier. According to the uSwitch article below:
This is a particular issue for the most vulnerable of customers, including the elderly, who view switching as ‘impossible’.
But the elderly were not the only consumers losing out; the CMA found that those customers most likely to be on expensive standard tariffs were less educated, or on lower incomes, or single parents, and did not necessarily have access to the Internet.
And the problem of penalising ‘loyalty’ customers who do not shop around applies in other industries, most notably banking. People who regularly switch savings accounts can get higher interest rates, often for a temporary ‘introductory’ period. Similarly, people who regularly transfer credit card debt from one card to another can take advantage of low interest rate, or even zero interest rate, deals for an introductory period.
Returning to the energy industry. Is the problem one of oligopoly? Do the big six have too much market power and, if so, what can be done about it? Should they be split up? Should regulation be tightened? Should new entrants be encouraged and, if so, what specific measures can be taken? The following articles explore the issues and possible policies.
Articles
British energy customers missed out on savings Reuters, Nina Chestney (18/2/15)
U.K. Energy Customers Could Save by Shopping Around: CMA BloombergBusiness, Aoife White (18/2/15)
Big six energy firms overcharging customers by up to £234 a year The Guardian, Sean Farrell (18/1/15)
Big six energy firms may lose quarter of customers by 2020, analysts warn The Guardian, Terry Macalister (1/10/14)
UK watchdog says big energy groups do not enjoy unfair advantage Financial Times, Michael Kavanagh (18/2/15)
CMA energy market investigation update: millions are punished for being loyal uSwitch, Lauren Vasquez (19/2/15)
Gas and electricity bills – the key questions Channel 4 News (18/2/15)
Energy customers miss big savings, says CMA inquiry BBC News, John Moylan (18/2/15)
Big Six energy companies overcharging loyal customers by up to £234 a year says watchdog Independent, Simon Read (18/2/15)
Consumer groups demand change after ‘Big Six’ accused of penalising customers out of hundreds of pounds Independent, Simon Read (19/2/15)
Energy companies’ loyalty problem lights the way forward The Conversation, Bridget Woodman (19/2/15)
CMA press releases and reports
Energy market investigation – updated issues statement Competition and Markets Authority (18/2/15)
Energy market investigation Competition and Markets Authority (23/2/15)
Energy Market Investigation: Updated Issues Statement Competition and Markets Authority (18/2/15)
Questions
- What barriers to entry exist in the electricity and gas supply markets?
- Explain how the big six are practising price discrimination. What form does it take and how are the markets separated?
- Find out what tariffs are offered by each of the big six. When you have done so, reflect on how easy it was to find out the information and why so few customers switch.
- How could more people be encouraged to ‘shop around’ and switch energy suppliers?
- Explain the five theories of harm identified by the CMA. Would a rise in market share of the smaller energy suppliers adequately combat each of the five types of harm?
- In what ways may UK energy regulation be ‘a barrier to pro-competitive innovation and change’?
- What are the arguments for and against breaking up the big six?
- What are the arguments for and against electricity and gas price control?
 The recent low price of oil has been partly the result of faltering global demand but mainly the result of increased supply from shale oil deposits. The increased supply of shale oil has not been offset by a reduction in OPEC production. Quite the opposite: OPEC has declared that it will not cut back production even if the price of oil were to fall to $30 per barrel.
We looked at the implications for the global economy in the post, A crude indicator of the economy (Part 2). We also looked at the likely effect on oil prices over the longer term and considered what the long-run supply curve might look like. Here we examine the long-run effect on prices in more detail. In particular, we look at the arguments of two well-known commentators, Jim O’Neill and Anatole Kaletsky, both of whom have articles on the Project Syndicate site. They disagree about what will happen to oil prices and to energy markets more generally in 2015 and beyond.
Jim O’Neill argues that with shale oil production becoming unprofitable at the low prices of late 2014/early 2015, the oil price will rise. He argues that a good indicator of the long-term equilibrium price of oil is the five-year forward price, which is much less subject to speculation and is more reflective of the fundamentals of demand and supply. The five-year forward price is around $80 per barrel – a level to which O’Neill thinks oil prices are heading.
 Anatole Kaletsky disagrees. He sees $50 per barrel as a more likely long-term equilibrium price. He argues that new sources of oil have made the oil market much more competitive. The OPEC cartel no longer has the market power it had from the mid 1970s to the mid 1980s and from the mid 2000s, when surging Chinese demand temporarily created a global oil shortage and strengthened OPEC’s control of prices. Instead, the current situation is more like the period from 1986 to 2004 when North Sea and Alaskan oil development undermined OPEC’s power and made the oil market much more competitive.
Kaletsky argues that in a competitive market, price will equal the marginal cost of the highest cost producer necessary to balance demand and supply. The highest cost producers in this case are the shale oil producers in the USA. As he says:
Under this competitive logic, the marginal cost of US shale oil would become a ceiling for global oil prices, whereas the costs of relatively remote and marginal conventional oilfields in OPEC and Russia would set a floor. As it happens, estimates of shale-oil production costs are mostly around $50, while marginal conventional oilfields generally break even at around $20. Thus, the trading range in the brave new world of competitive oil should be roughly $20 to $50.
So who is right? Well, we will know in twelve months or more! But, in the meantime, try to use economic analysis to judge the arguments by answering the questions below.
The Price of Oil in 2015 Project Syndicate, Jim O’Neill (7/1/15)
A New Ceiling for Oil Prices Project Syndicate, Anatole Kaletsky (14/1/15)
Questions
- For what reasons might the five-year forward price of oil be (a) a good indicator and (b) a poor indicator of the long-term price of oil?
- Under O’Neill’s analysis, what would the long-term supply curve of oil look like?
- Are shale oil producers price takers? Explain.
- Draw a diagram showing the marginal and average cost curves of a swing shale oil producer. Put values on the vertical axis to demonstrate Kaletsky’s arguments. Also put average and marginal revenue on the diagram and show the amount of profit at the maximum-profit point.
- Why are shale oil producers likely to have much higher long-run average costs than short-run variable costs? How does this affect Kaletsky’s arguments?
- Under Kaletsky’s analysis, what would the long-term supply curve of oil look like?
- Criticise Kaletsky’s arguments from O’Neill’s point of view.
- Criticise O’Neill’s arguments from Kaletsky’s point of view.
- Will OPEC’s policy of not cutting back production help to restore its position of market power?
- Why might the fall in the oil price below $50 in early 2015 represent ‘overshooting’? Why does overshooting often occur in volatile markets?
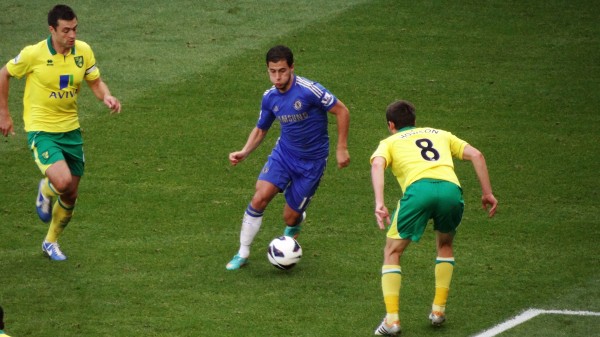
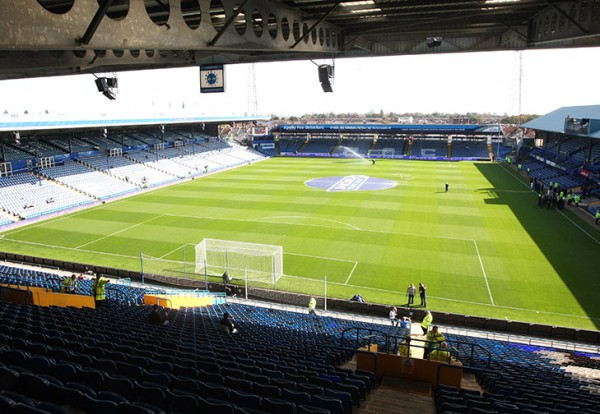 Most observers were once again left stunned by how much media companies are willing to pay to secure the rights to broadcast live games in the English Premier League (EPL). At the same time the method used to sell those rights is being investigated by Ofcom following complaints made by Virgin Media. Virgin Media actually requested that the auction was halted until the investigation was completed.
Between them, BSkyB and BT Sport have paid £5.136bn to purchase the rights to broadcast live matches in the EPL over a three-year period beginning in the 2016–17 season. This is a 71% increase in the price paid for the previous three-year deal which runs from 2013 to 2016 and cost £3.018bn. However, the headline figure hides some big differences between the amounts paid by the two companies.
How exactly are the rights sold? The broadcast rights for the 168 live matches are split up into seven different packages labelled A through to G and are placed in seven different auctions. The type of auction used by the EPL is a sealed bid auction. Interested companies are invited to make an offer for any of the packages. However, when they make a bid they do not know (a) if other firms have also made a bid and (b) the size of any other bids. Another constraint is that one firm is not allowed to win more than five of the auctions. When the auction finishes the EPL only releases information about the winning offers. It never provides information about any of the failed bids.
Some of the packages are worth more than others to the broadcasters. The first five packages (A–E) each contain the rights for 28 games per season, while the other two packages (F and G) contain the rights for 14 matches. In some of the packages all of the games kick off at the same time and on the same day. For example all 28 games in package ‘A’ kick off at 12.30pm on a Saturday. Others contain more of a mixture. Some of the games in Package E take place on a Monday evening. while others take place on a Friday evening. Given the potential advertising revenue and number of viewers, the most valuable package is D, which has 28 games that kick off at 4.00pm on a Sunday.
Another factor that influences the value of a package is the number of ‘first picks’. In any given week, more than one broadcaster might want to screen the same match. To overcome this problem, each package is allocated a number of first, second, third, fourth and fifth ‘picks’. For example, package D comes with 18 first and 10 fourth round picks. This means that whichever company wins this package will get first choice on the games they want to broadcast on 18 occasions a year. Package C contains no ‘first picks’ but offers 15 second, 4 fourth and 7 fifth round picks. There is also a maximum and a minimum limit on the number of times games including a specific team can be broadcast.
BSkyB won the auctions for packages A, C, D, E and G for a price of £4.17bn. This means that it will be paying £1.396bn to broadcast 126 live games per season. This is an average payment of £11,031,700 per game. In the previous deal it paid £760million for the rights to broadcast 116 live games per season. This is an average payment of £6,551,724 per game. The new deal represents a cost increase of 68% per game. However, the number of first picks BskyB has secured in the new deal increases from 20 to 26.
BTSport won the auctions for packages B and F for a price of £960m. This means that it will be paying £320m for the rights to broadcast 42 live games per season. This is an average payment of £7,619,048 per game. In the previous deal it paid £246 million per year for the rights to broadcast 38 live games per season. This is an average payment of £6,473,684 per game. The new deal represents an increase in costs of 17.7% per game for BT Sport – a much lower figure than for BSkyB.
BSkyB has stated that it will cover the increase in the price it has paid for the rights with efficiency savings. However, many observers believe that it will ultimately result in significant increases in the subscription rates for SkySports. The impact of the deal on BskyB’s profit may well depend on the willingness of its customers to pay higher prices. What is the price elasticity of demand for SkySports at the current subscription rates they are charging?
There is still some uncertainty about the deal following Ofcom’s decision to investigate the legitimacy of the method used by the EPL to auction the rights. Virgin Media made a formal complaint in September 2014 about the collective selling of the live broadcast rights and argued that it was in breach of competition law. The investigation by Ofcom will make a judgment about whether the joint selling of the rights by the EPL is a contravention of Chapter I of the Competition Act 1998 and/or Article 101(1) of the Treaty on the Functioning of the European Union. An initial announcement will be made in March.
Premier League set to announce record £4.4bn TV rights deal BBC Sport (10/2/15)
Premier League TV rights: What does deal mean for fans & clubs BBC Sport, Ben Smith (11/2/15)
How Sky paid £4m more per Premier League match than BT The Telegraph, Ben Rumsby (11/2/15)
Premier League TV deal: Windfall must benefit grass roots and England The Telegraph, Henry Winter (10/2/15)
Sky and BT retain Premier League TV rights for record £5.14bn The Guardian, Owen Gibson (10/2/15)
Premier League TV rights: Sky Sports and BT Sport win UK broadcasting rights as price tops £5billion Independent, Tom Peck (10/2/15)
Questions
- Draw a demand curve for package A and package D of the live broadcast rights. Which one do you think will be furthest to the right? Explain your answer.
- What are the potential benefits to the EPL of not revealing the details of any of the losing bids?
- Explain how the price elasticity of demand is a useful concept for assessing the impact of the new deal on the profits of BSkyB and BTSport.
- Given the impact of the new deal of the size of Parachute payments, what impact might it have on the level of competitive balance in the Championship?
- Find out the key provisions of Chapter I of the Competition Act 1998 and Article 101(1) of the Treaty on the Functioning of the European Union.
 In the UK, we take it for granted that if you need to see a doctor, you go and give little, if any thought, to the cost. It may be petrol costs, time off work or the cost of a prescription, but beyond that, receiving treatment is free at the point of use. Funded through a progressive tax system, the NHS is seen as being one of the more equitable health care systems.
When a mother gives birth, the main thing she will have to worry about is the labour – and not whether to have certain painkillers or stay an extra night, because of the cost.
The International Federation of Health Plans (IFHP) looked at data on the cost of giving birth, based on insurance company payments. For someone living in the UK, the figures make for quite astonishing reading. In the USA, a normal delivery will cost $10,000, while a caesarean totals $15,000, meaning that giving birth in the USA is the most expensive place in the world. The article linked below takes the case of Mari Roberts, whose total delivery bill came to over $100,000. The insurance did cover it, but that’s not always the case. Medical bills in the United States are one of the leading reasons for bankruptcy and with these types of figures, perhaps it’s hardly surprising.
Other countries also see high costs for delivery, where expectant mothers really do need to give consideration to the length of their stay in hospital and perhaps even whether they are willing to forgo a pain-relieving drug and save some money. There is often said to be an efficiency–equity trade-off in the area of healthcare, with countries offering a free at the point of use service delivering an equitable system, but with a lack of responsiveness to the demands of the patients. In the UK, you don’t pay to see a doctor but, with a ‘free’ service, demand is understandably very high, thus creating a shortage and waiting lists. In countries, such as the USA, a higher price for treatment does limit demand, creating more inequity but a responsive system.
There are certainly lessons that can be learned from all health care systems and living in a developed country, we should certainly consider ourselves lucky. There are many countries where access to even the most basic health care is a luxury that most cannot afford. So, where does have the best health care system? I’ll leave that to you.
Video and article
 How much do women around the world pay to give birth? BBC News, Mariko Oi (13/2/15)
Report
Research for Universal Health Coverage, World Health Report 2013 World Health Organisation August 2013
Health Systems Financing: The Path to Universal Coverage, World Health Report 2010 World Health Organisation August 2010
Questions
- Using a demand and supply diagram, explain why there may be a trade-off between efficiency and equity.
- If there is over-consumption of a service such as health care, does this suggest that the market fails?
- What are the main market failures that exist in health care?
- Is the concept of opportunity cost relevant to mothers in labour? Think about the country in question.
- How would you go about ranking health care systems if you worked for an organisation such as the OECD or WHO?
- Pick a country whose health care system you are familiar with. What changes have occurred to the way in which health care is organised and financed in this country? How has it affected the key objectives that formed part of your answer to question 5?
 Many important economic changes have occurred over the past two years and many have occurred in the past two months. Almost all economic events create winners and losers and that is no different for the Russian economy and the Russian population.
There is an interesting article plus videos on the BBC News website (see link below), which consider some of the economic events that, directly or indirectly, have had an impact on Russia: the fall in oil prices; the conflict between Russia and the Ukraine; the fall in the value of the rouble (see chart); the sanctions imposed by the West.
Clearly there are some very large links between events, but an interesting question concerns the impact they have had on the everyday Russian consumer and business. Economic growth in  Russia has been adversely affected and estimates suggest that the economy will shrink further over the coming year. Oil and gas prices have declined significantly and while this is good news for many consumers across the world, it brings much sadder tidings for an economy, such as Russia, that is so dependent on oil exports.
However, is there a bright side to the sanctions or the falling currency? The BBC News article considers the winners and losers in Russia, including families struggling to feed their families following spending cuts and businesses benefiting from less competition.
Russia’s economic turmoil: nightmare or opportunity? BBC News, Olga Ivshina and Oleg Bodyrev (5/2/15)
Questions
- Why has the rouble fallen in value? Use a demand and supply diagram to illustrate this.
- What does a cheap rouble mean for exporters and importers within Russia and within countries such as the UK or US?
- One of the businesses described in the article explain how the sanctions have helped. What is the explanation and can the effects be seen as being in the consumer’s interest?
- Oil prices have fallen significantly over the past few months. Why is this so detrimental to Russia?
- What is the link between the exchange rate and inflation?
 Over 90% of UK households buy their gas and electricity from one of the ‘big six’ energy suppliers – British Gas (Centrica), EDF, E.ON, npower (RWE), Scottish Power (Iberdrola) and SSE. The big six are currently being investigated by the Competition and Markets Authority (CMA) for possible breach of a dominant market position.


