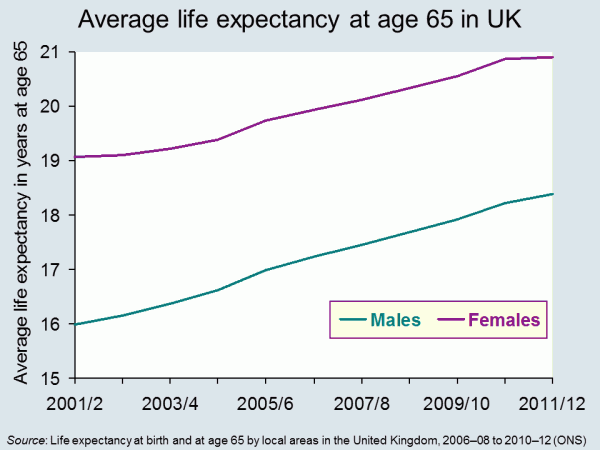
 Life expectancy is increasing across the world and the latest set of figures from the Office for National Statistics show that in the UK it has passed 79 for boys born in 2010–12, and 82 for girls born then. In fact the prediction is that over a third of babies born in 2013 will live to more than 100. The data throws up some interesting questions. How well prepared are we for lives that last this long? And how evenly distributed is this increase in life expectancy? Pensions’ minister, Steve Webb, has called for better information on life expectancy to be shared. How would this impact on our decision making?
It seems reasonable to think that increasing life expectancy must be good news. And of course, for individuals it can be. In 1951 the average man retiring at 65, in England and Wales, could expect to live and draw a pension for another 12.1 years. By 2014 this had risen to 22 years.
 But while we can look forward to longer life, for the government, it presents some challenges The first is that we just don’t save enough for our old age. This seems to be partly because we find it hard to make decisions that will have an impact so far in the future. There are a number of measures that have been put in place to encourage us to save more, including auto-enrolment into company pension schemes. This is being rolled out across businesses over the next three years. In the 2014 Budget, the Chancellor announced that people reaching retirement age will be able to draw all their pension as a cash lump sum, rather than having to take it as a regular income.
Another concern for government is the variations that we find in life expectancy across the UK. The 2014 ONS data identified that life expectancy for men born in Glasgow in 2012 is 72.6, in East Dorset it is 82.9. 25% of those in Glasgow are not expected to live to 65. The gap in years of good health is even greater. This presents governments with a long-term problem. How do they achieve greater equality in this instance? Do they focus resources on the areas that need it most? Do they legislate to address behaviour? Or do they rely on the provision of good advice – on diet, exercise and other factors?
Information has a role to play in both areas identified above. In April 2014, Steve Webb, suggested that in order to make good decisions at the point of retirement, people need to understand more about what lies ahead. He said:
People tend to underestimate how long they’re likely to live, so we’re talking about averages, something very broad-brush. Based on your gender, based on your age, perhaps asking one or two basic questions, like whether you’ve smoked or not, you can tell somebody that they might, on average, live for another 20 years or so.
This suggestion has led to some concerns being expressed at what appears to be an over-simplistic approach. Estimates can only be based on a mix of averages modified by individual information. Would the projections be shared with pension providers? What would you do if you exceeded your forecast life expectancy – by a long way – and had spent all your money? Could you sue someone?
Will your pension pot last as long as you will? The Telegraph, Dan Hyde and Richard Dyson (23/4/2014)
Scientists invent death test that will tell us how long we have to live Metro (11/8/13)
Games host Glasgow has worst life expectancy in the UK The Guardian, Caroline Davies (16/4/2014)
Pensioners could get life expectancy guidance BBC News Politics (17/4/14)
ONS reveals gaps in life expectancy across the UK FT Adviser Pensions, Kevin White (23/4/14)
Health care aid for developing countries boosts life expectancy Health Canal, Ruth Ann Richter (22/4/14)
A third of babies born this year will live to 100 This is Money.co.uk, Adam Uren (11/12/13)
Questions
- Thinking about the UK, what are the factors that might explain variations in life expectancy across different regions? How might the government address these differences? Why would they want to do so?
- Do the same factors explain variations between countries? Who can address these differences? Who would want to do so?
- If you could have a reasonable prediction of your life expectancy at 65, would you want it? How would your behaviour change if you were predicted a longer than average life expectancy? How would it change if you were predicted a shorter than average life expectancy?
- If you could have an accurate prediction of your life expectancy at 18, how would your answers differ? If this were possible, would it present any problems?
 VAT was introduced on the 1st of April 1973, as part of the conditions for the UK entering the Common Market. Designed by a French tax expert, Maurice Lauré, it was initially envisaged as a straightforward replacement for purchase tax, which would be applied to most goods and services.
Forty years on, VAT is increasingly complex, with numerous exemptions, many anomalies in its scope, and increasingly expensive challenges to its imposition. How did we get to this point? And is it time for VAT to undergo a mid-life makeover?
All governments have to raise taxes – to redistribute income and to fund public spending. They have a number of mechanisms they can use, but essentially they have to tax incomes (direct taxes), spending (indirect taxes) or a mix of both. The main indirect tax in the UK is VAT, which now raises over £100bn a year, compared with £1.5bn in its first year (see above chart: click here for a PowerPoint version). Initially envisaged as a simple, cross-Europe purchase tax, the current system is complex and at times appears to have been formulated ‘on the hoof’, never a good way to build a tax system.
In the 2012 Budget, the Chancellor decided to apply the standard rate of income tax to hot takeaway pasties; previously they had been zero-rated. However, he had sharply underestimated the ability of the industry to lobby against the tax, working closely with the tabloid press. Perhaps more importantly, he also missed the complex nature of the good; when is a hot pasty just cooling down? And what is hot? The government backtracked and now 20% VAT is only charged on pasties that are deliberately kept hot. You might think that this change of heart avoided introducing an anomaly, but consider how you might feel if you sell takeaway baked potatoes, which are subject to VAT.
Apart from the complexity of the system, VAT is unpopular with some commentators who feel that it falls too heavily on low-income households. Although many foodstuffs are zero-rated and housing is exempt, VAT is charged at 20% on clothing and many necessities such as cleaning materials. Gas and electricity are subject to a reduced rate of 5% and both alcohol and cigarettes have additonal excise duties imposed and yet are disproportionally consumed by the poor. When the standard rate of VAT was temporarily dropped to 15% in 2010, but then permanently raised to 20% in 2011, many felt that this was a shift in the tax burden to the poor.
So complex, irrational and prone to changes following political lobbying or expensive legal cases, VAT does seem to be stumbling into its forties under something of a cloud. However, it remains the case that it raises a large proportion of UK tax revenues at relatively low direct cost and provides the Chancellor with a reasonably effective fiscal policy tool. Even if a government wanted to put in place an alternative, it is likely that the associated political risks would be too high for it to do so. We might hope for some rationalisation of the current system, but there is little doubt that we will be raising a glass to VAT’s 50th birthday in 2023.
The links below include some articles on VAT’s 40th birthday and some more general articles on VAT.
Articles
VAT is 40 years old- and now has middle-age spread The Guardian, Juliette Garside (31/1/13)
Is VAT suffering a mid-life crisis at 40? BBC News, Colin Corder (31/3/13)
VAT at 40, not simple, not popular, but central to government revenue-raising The Chartered Institute of Taxation (28/3/13)
Happy birthday VAT, here’s how not to pay you The Telegraph, Rosie Murray-West (31/3/13)
Poorest spend higher proportion of VAT than richest BBC News (31/10/11)
A Value- Added Tax offers much to love- and hate New York Times, Gregory Mankiw (1/5/10)
EC Standard VAT Declaration European Commission Roadmap (2012)
Data and information
VAT pages HMRC
Public sector finance statistics HM Treasury (follow link to latest Public finances databank (Excel file) and go to Worksheet C2)
Latest European Union EU VAT rates VATLive
Questions
- Explain why VAT might be deemed regressive. Can you formulate an argument that it falls more heavily on the rich than the poor?
- Why is VAT administratively cheap? Other than generating tax revenues, can you think of any advantages of the tax?
- Newspapers and books are zero-rated in the UK, while e-books and news apps are standard rated at 20%. Can you identify some other anomalies in the UK VAT system? Is there an argument that a better approach would be to charge a lower rate on all goods and services?
- Who pays VAT, consumers or producers? Illustrate your answer with a diagram, or two.
- A business has to register for VAT once it has a turnover of £77,000 pa. Does this system give rise to any perverse incentives?
- Countries across the European Union have varying VAT rates, applied to very different ranges of products. Explain why this might hinder the workings of a single European market.
- Imagine you were running a brand new economy; would you use a value-added tax to raise revenues? What are the alternatives open to governments?
 House prices have long been an obsession with the UK media and much of the public; when they rise, homeowners feel rich, when they fall, consumer confidence dives. Following the financial crisis and subsequent recession, there has been a great deal of attention focused on the overall health of the housing market.
But the UK faces a particular problem of a sharp and growing divide in regional house prices. First time buyers in London face having to find high deposits and even then, many are unable to access mortgages. Meanwhile those in the regions can access more affordable housing, but may be reluctant to enter the market when prices are stagnant. What are the implications of this divide for the housing market and for the broader economy?
The housing market demonstrates characteristics which are typical of those for goods that are both consumable and involve capital growth; when prices rise housing is seen as a good ‘investment’ and demand increases, this in turn leads to higher prices. Conversely when values drop, demand falls and the market slumps. Markets like this are described as being prone to price bubbles.
 Looking at UK house prices as a whole can, however, mask large variations across the economy; variations which can cause problems for jobseekers, for employers and for the government. Recently one of the UK’s largest mortgage lenders predicted continuing regional variance in house prices. Halifax’s figures looked at the price of housing across a number of UK towns and showed that changes seen during 2012 ranged from a 14.8 per cent rise to an 18.4 per cent fall. The biggest rise seen during the year was in Southend on Sea, in Essex, while the greatest fall was in Craigavon, in Northern Ireland. Of the ten towns with the biggest rises, eight were found in London or the south east, with Durham being the only northern town showing growth. Of the ten towns that the Halifax identified with the biggest falls, four are in Scotland, three are in the north west, one is in the north of England and one is in Northern Ireland.
Martin Ellis, housing economist at the Halifax, said:
We expect continuing broad stability in house prices nationally in 2013. The generalised north/south divide in house price performance seen during 2012 is likely to continue next year. House prices are expected to be strongest in London and the south east as this part of the country performs best in economic terms.
These disparities present a particular problem in a recession. While London and the south east show signs of economic growth, with relatively low unemployment and high levels of inward investment, many regions outside London see house prices falling further as unemployment grows. There are some exceptions – the arrival of the BBC in Salford has resulted in a sharp increase in prices there – but, in general, confidence is low outside the south east.
The articles below consider regional differences in the housing market.
Articles
House prices creep up over 2012 The Guardian, Patrick Collinson (29/1/13)
Which regions of the UK will show the biggest house price rises in the next 5 years? This is Money, Rachel Rickard Straus (17/1/13)
Figures reveal scale of regional house price divide Inside Housing, Tom Lloyd (2/1/13)
Property market gets a budget boost, so are things looking up? This is Money, Simon Lambert (21/3/13)
Help to Buy scheme could drive up house prices, says OBR The Guardian, Josephine Moulds and Jennifer Rankin (26/3/13)
London house prices outstrip 2007 peak with a 2.8% increase The Guardian, Hilary Osborne (28/3/13)
Housing market in southeast is worth £2tn Financial Times, James Pickford and Ed Hammond (1/2/13)
House prices show annual increase Evening Standard (28/3/13)
House price data
Links to house price data The Economics Network
Regional Historical House Price Data Halifax House Price Index (Lloyds Banking Group)
Questions
- Thinking about the market for owner-occupied housing, what are the factors that will determine demand? How might these explain variations in demand across different regions of the UK?
- How does the supply of housing vary across the UK?
- What would you predict about regional variations in rents?
- What is the impact of high house prices in London on first time buyers? Does this matter?
- What are the implications for the labour market of sharp variations in house prices across regions?
- Why might the Chancellor want to put in place policies to boost the housing market?
- Who gains from high house prices? Who loses? You might want to think about this in term of the life-cycle.
 Life expectancy is increasing across the world and the latest set of figures from the Office for National Statistics show that in the UK it has passed 79 for boys born in 2010–12, and 82 for girls born then. In fact the prediction is that over a third of babies born in 2013 will live to more than 100. The data throws up some interesting questions. How well prepared are we for lives that last this long? And how evenly distributed is this increase in life expectancy? Pensions’ minister, Steve Webb, has called for better information on life expectancy to be shared. How would this impact on our decision making?
 But while we can look forward to longer life, for the government, it presents some challenges The first is that we just don’t save enough for our old age. This seems to be partly because we find it hard to make decisions that will have an impact so far in the future. There are a number of measures that have been put in place to encourage us to save more, including auto-enrolment into company pension schemes. This is being rolled out across businesses over the next three years. In the 2014 Budget, the Chancellor announced that people reaching retirement age will be able to draw all their pension as a cash lump sum, rather than having to take it as a regular income.