Last week was a rough week for Britain. The “Beast from the East” and storm Emma swept through the country, bringing with them unusually heavy snowfall, which resulted in severe disruption across nearly all parts of the country. Some recent estimates put the cost of these extreme weather conditions at up to £1 billion per day. The construction industry suffering the biggest hit as work came to a halt for the best part of the week. Losses for the industry were estimated to be up to £2 billion.
Closed restaurants, empty shops and severely disrupted transport networks were all part of the effect that this extreme weather had on the overall economy. According to Howard Archer, chief economic adviser of the EY ITEM Club (a UK forecasting group):
It is possible that the severe weather [of the last few days] could lead to GDP growth being reduced by 0.1 percentage point in Q1 2018 and possibly 0.2 percentage points if the severe weather persist.
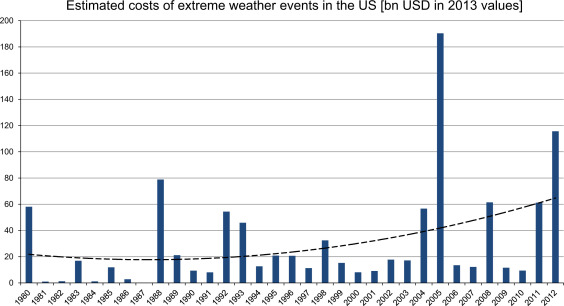
Source: Jahn (2015), Figure 2
As the occurrence of freak weather increases across the globe due to climate change, so does the economic cost of these events. The figure above shows the estimated costs of extreme weather events in the USA between 1980 and 2012 and it is reproduced from Jahn (see link below), who also fits a quadratic trend to show that these costs have been increasing over time. He goes on to characterise the impact of different types of extreme weather (including cold waves, heat waves, storms and others) on different sectors of the local economy – ranging from tourism and agriculture, to housing and the insurance sector.
Linnenluecke et al (linked below) argue that extreme weather caused by climate change could influence the decision of firms on where to locate and could lead to a reshuffle of economic activity across the world and have important policy implications. As the authors explain:
Climate change-related relocation has been given consideration in policy-oriented discussions, but not in management decisions. The effects of climate change and extreme weather events have been considered as peripheral or as a risk factor, but not as a determining factor in firm relocation processes…. This paper therefore [provides] insights for understanding how firms can enhance strategic decision-making in light of understanding and assessing their vulnerability as well as likely impacts that climate change may have on relocation decisions.
The likelihood and associated costs of extreme weather events could therefore become an increasingly important matter for discussion amongst economists and policy makers. Such weather events are likely to have profound economic implications for the world.
Would you start a family if you were pessimistic about the future of the economy? Buckles et al (2017) (see link below) believe that fewer of us would do so and, therefore, fertility rates could be used by investors and central banks as an early signal to pick up subtle changes in consumer confidence and overall economic climate.
Their study titled ‘Fertility is a leading economic indicator’ uses ‘live births’ data, sourced from US birth certificates, to explore if there is any association between fertility changes (measured as the rate of change in number of births) and GDP growth. Their results suggest that, in the case of the USA, there is: dips in fertility rates tend to precede by several quarters slowdown in economic activity. As the authors state:
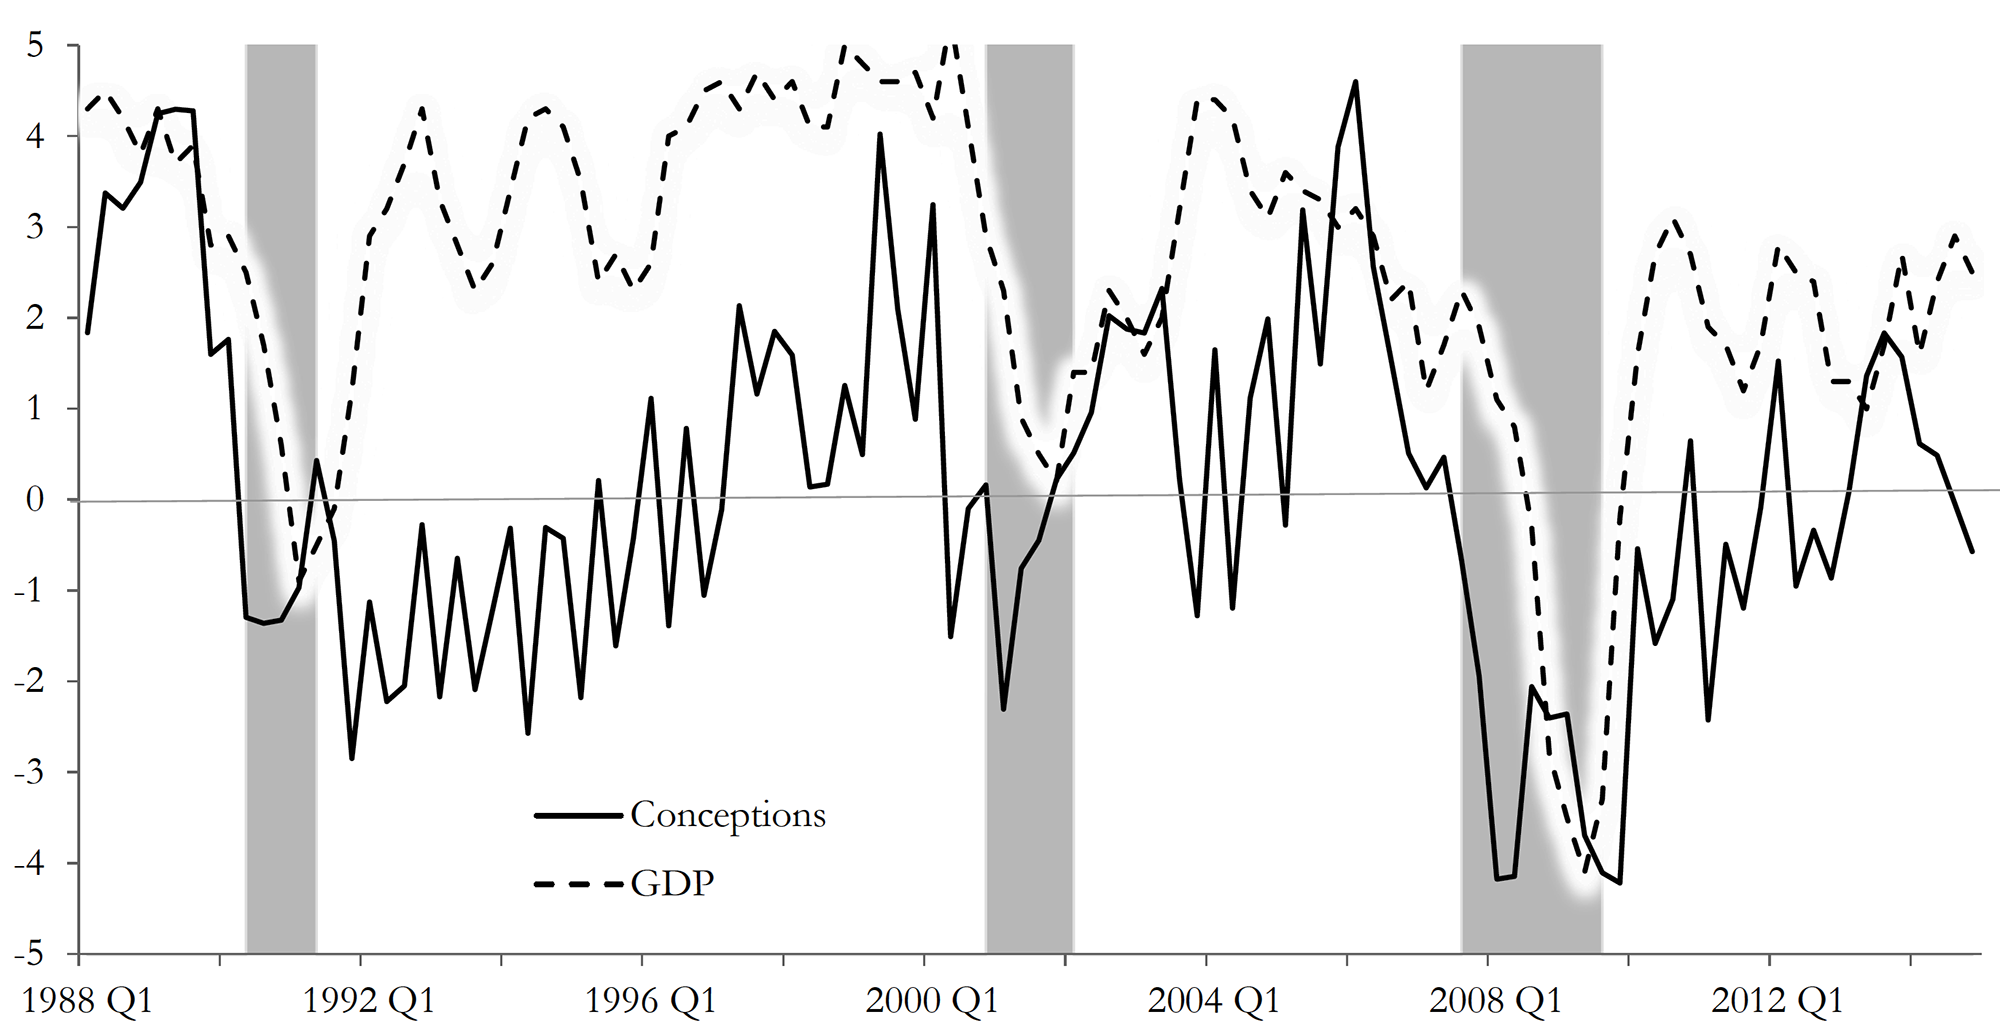
The growth rate of conceptions declines prior to economic downturns and the decline occurs several quarters before recessions begin. Our measure of conceptions is constructed using live births; we present evidence suggesting that our results are indeed driven by changes in conceptions and not by changes in abortion or miscarriage. Conceptions compare well with or even outperform other economic indicators in anticipating recessions.
Conception and GDP Growth Rates (source Buckles et al p33: see below)
Although this is not the first piece of academic writing to claim that fertility has pro-cyclical qualities (see for instance, Adsera (2004, 2011), Adsera and Menendez (2011), Currie and Schwandt (2014) and Chatterjee and Vogle (2016) linked below), it is, to the best of our knowledge, the most recent paper (in terms of data used) to depict this relationship and to explore the suitability of fertility as a macroeconomic indicator to predict recessions.
Economies, after all, are groups of people who participate actively in day-to-day production and consumption activities – as consumers, workers and business leaders. Changes in their environment should affect their expectations about the future.
Are people, however, forward-looking enough to guide their current behaviours by their expectations of future economic outcomes? They may be, according to the findings of this study.
Did you know, for instance, that sales of ties tend to increase in economic downturns, as men buy more ties to show that they are working harder, in fear of losing their job[1]? But this is probably a topic for another blog.
Give two reasons why fertility rates may be a good indicator of economic activity.
Give two reasons why fertility rates may NOT be a good indicator of economic activity.
Do a literature search to identify and explain an ‘unorthodox’ macroeconomic indicator of your choice, and how it has been used to track economic activity.
Senior Bank of England officials appeared before the House of Commons’ Treasury Select Committee on 21 February to report on the state of the economy and the future path for inflation and interest rates. One topic considered was the role of depreciation.
The pound has depreciated since the referendum on EU membership in June 2016. The exchange rate index today is some 9% below that before the referendum and 15% below the peak a year before the referendum.
It had fallen as much as 14% by October 2016 below the level before the referendum and 20% below its peak, pushed down partly by the cut in Bank Rate from 0.5% to 0.25% following the referendum. In November 2017, the Bank’s Monetary Policy Committee raised Bank Rate back to 0.5%. Two or three more rises of 25 basis points are expected over the next couple of years. This has helped to strengthen sterling somewhat. (Click here for a PowerPoint of the chart below.)
But has the depreciation been advantageous or disadvantageous to the economy? Here the Governor (Mark Carney) and the Chief Economist (Andy Haldane) appeared to differ. Andy Haldane said:
A combination of the weaker pound and a stronger global economy has worked its magic. That has meant that net trade has been a significant contributor, and we expect those effects to continue over the next two or three years. … Depreciations work, and that’s how they work.
By contrast, Mark Carney said:
Depreciations don’t work. They have an economic effect, but they’re not a good economic strategy. They may be an outcome of various things … but it’s how you make yourself poorer.
Are these statements contradictory or are they simply emphasising different effects of depreciation?
Both Andy Haldane and Mark Carney would accept that a depreciation makes imports more expensive and thus reduces real incomes (at least in the short run). They would also accept that a depreciation makes exports priced in pounds cheaper in foreign currency terms and thus can boost the demand for exports.
There is disagreement over two things, however. The first is the effect on people’s real incomes in the long run. Will any fall in real incomes from higher-priced imports in the short run be offset in the long run by higher economic growth?
This relates to a second area of disagreement. This is whether a depreciation can act as a significant driver for exports over the longer term. The increased incentive on the demand side (from consumers abroad to buy UK exports) could be offset by a disincentive for exporters to become more efficient and/or to compete in terms of quality. In other words, although it can give exporters a price advantage, the crucial question is the extent to which they take advantage of this, or merely take higher profits.
The disagreements thus relate primarily to the incentive effects over the longer term.
How does a depreciation affect the demand for and supply of imports and exports?
What determines the size of the effect on inflation of a depreciation?
What is the significance of the price elasticity of demand for and supply of sterling in determining the size of depreciation resulting from a change in confidence or a change in interest rates?
How does productivity growth impact on the effectiveness of a depreciation in leading to higher economic growth?
In what ways might a depreciation affect productivity growth?
The Winter Olympics are full on as athletes from all over the world compete against each other, hoping to set new world records, win medals and be known as Olympians. Pyeongchang, the South Korean county that hosts the 2018 Winter games, enjoys a large influx of tourists – estimated at 80,000 people a day. This is certainly an unusually large number of tourists for a region that has a regular winter-time population of no more than 45,000 people.
Having such a high number of visitors to the Winter Olympics, and even more to the larger Summer Olympics, is not an unusual occurrence, however, and it is often mentioned as one of the benefits of being a host to the Olympic Games.
Baade and Matheson (see link below) distinguish between three key benefits of hosting the Olympic Games: “the short-run benefits of tourist spending during the Games; the long-run benefits or the ‘Olympic legacy’, which might include improvements in infrastructure and increased trade, foreign investment, or tourism after the Games; and intangible benefits such as the ‘feel-good effect’ or civic pride”.
On these grounds, a number of studies have been authored, attempting to analyse some or all of these benefits, distinguishing between short-term and long-term effects. Müller (see link below), uses data from the 2014 Oympic Games in Sochi, Russia, to assess the net economic outcome for the host region. He concludes that any short-term economic benefits caused by the investment influx (before and during the games) could not offset the long-term costs, leading to an estimated net loss of $1.2 billion per year.
Zimbalist (2015) and Szymanski (2011) report similar results when analysing data from the London Games (2012) and past major sporting events (Games and FIFA World Cup). Kasimati (2003) points out the significant economic benefits that host regions tend to enjoy for years after hosting the games, but argues that the overall effect depends on a number of factors (including pre-existing infrastructure and location).
The jury is, therefore, still out on what is the overall economic effect of being host to this ancient institution. But I must now dash as women’s hockey is soon to start. “Let everyone shine”.
Using supply and demand diagrams, explain whether you would expect hotel room prices to change during the hosting of a major sports event, such as the Winter Olympics.
List three economic (or economics-related) arguments in favour of and against the hosting of the Olympic games. Relate your answer to the empirical evidence presented in the literature.
Why is it so difficult to estimate with accuracy the net economic effect of the Olympic Games?
On 8 February, the Bank of England issued a statement that was seen by many as a warning for earlier and speedier than previously anticipated increases in the UK base rate. Mark Carney, the governor of the Bank of England, referred in his statement to ‘recent forecasts’ which make it more likely that ‘monetary policy would need to be tightened somewhat earlier and by a somewhat greater extent over the forecast period than anticipated at the time of the November report’.
A similar picture emerges on the other side of the Atlantic. With labour markets continuing to deliver spectacularly high rates of employment (the highest in the last 17 years), there are also now signs that wages are on an upward trajectory. According to a recent report from the US Bureau of Labor Statistics, US wage growth has been stronger than expected, with average hourly earnings rising by 2.9 percent – the strongest growth since 2009.
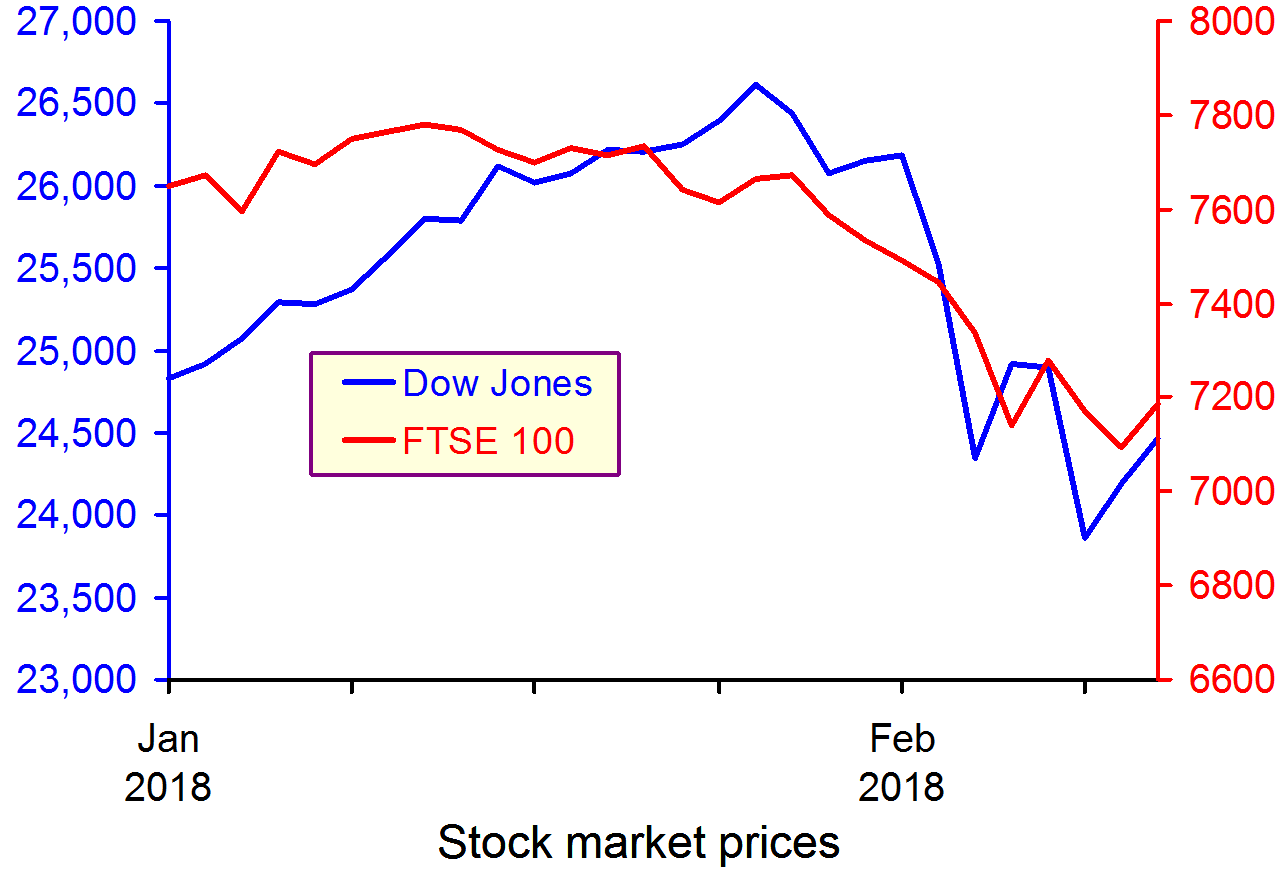
These statements have coincided with a week of sharp corrections and turbulence in the world’s largest capital markets, as investors become increasingly conscious of the threat of rising inflation – and the possibility of tighter monetary policy.
The Dow Jones plunged from an all-time high of 26,186 points on 1 February to 23,860 a week later – losing more than 10 per cent of its value in just five trading sessions (suffering a 4.62 percentag fall on 5 February alone – the worst one-day point fall since 2011). European and Asian markets followed suit, with the FTSE-100, DAX and NIKKEI all suffering heavy losses in excess of 5 per cent over the same period.
But why should higher inflationary expectations fuel a sell-off in global capital markets? After all, what firm wouldn’t like to sell its commodities at a higher price? Well, that’s not entirely true. Investors know that further increases in inflation are likely to be met by central banks hiking interest rates. This is because central banks are unlikely to be willing or able to allow inflation rates to rise much above their target levels.
The Bank of England, for instance, sets itself an inflation target of 2%. The actual ongoing rate of inflation reported in the latest quarterly Inflation Report is 3% (50 per cent higher than the target rate).
Any increase in interest rates is likely to have a direct impact on both the demand and the supply side of the economy.
Consumers (the demand side) would see their cost of borrowing increase. This could put pressure on households that have accumulated large amounts of debt since the beginning of the recession and could result in lower consumer spending.
Firms (the supply side) are just as likely to suffer higher borrowing costs, but also higher operational costs due to rising wages – both of which could put pressure on profit margins.
It now seems more likely that we are coming towards the end of the post-2008 era – a period that saw the cost of money being driven down to unprecedentedly low rates as the world’s largest economies dealt with the aftermath of the Great Recession.
For some, this is not all bad news – as it takes us a step closer towards a more historically ‘normal’ equilibrium. It remains to be seen how smooth such a transition will be and to what extent the high-leveraged world economy will manage to keep its current pace, despite the increasingly hawkish stance in monetary policy by the world’s biggest central banks.
Using supply and demand diagrams, explain the likely effect of an increase in interest rates to equilibrium prices and output. Is it good news for investors and how do you expect them to react to such hikes? What other factors are likely to influence the direction of the effect?
Do you believe that the current ultra-low interest rates could stay with us for much longer? Explain your reasoning.
What is likely to happen to the exchange rate of the pound against the US dollar, if the Bank of England increases interest rates first?
Why do stock markets often ‘overshoot’ in responding to expected changes in interest rates or other economic variables
 Last week was a rough week for Britain. The “Beast from the East” and storm Emma swept through the country, bringing with them unusually heavy snowfall, which resulted in severe disruption across nearly all parts of the country. Some recent estimates put the cost of these extreme weather conditions at up to £1 billion per day. The construction industry suffering the biggest hit as work came to a halt for the best part of the week. Losses for the industry were estimated to be up to £2 billion.