 On 8 February, the Bank of England issued a statement that was seen by many as a warning for earlier and speedier than previously anticipated increases in the UK base rate. Mark Carney, the governor of the Bank of England, referred in his statement to ‘recent forecasts’ which make it more likely that ‘monetary policy would need to be tightened somewhat earlier and by a somewhat greater extent over the forecast period than anticipated at the time of the November report’.
A similar picture emerges on the other side of the Atlantic. With labour markets continuing to deliver spectacularly high rates of employment (the highest in the last 17 years), there are also now signs that wages are on an upward trajectory. According to a recent report from the US Bureau of Labor Statistics, US wage growth has been stronger than expected, with average hourly earnings rising by 2.9 percent – the strongest growth since 2009.
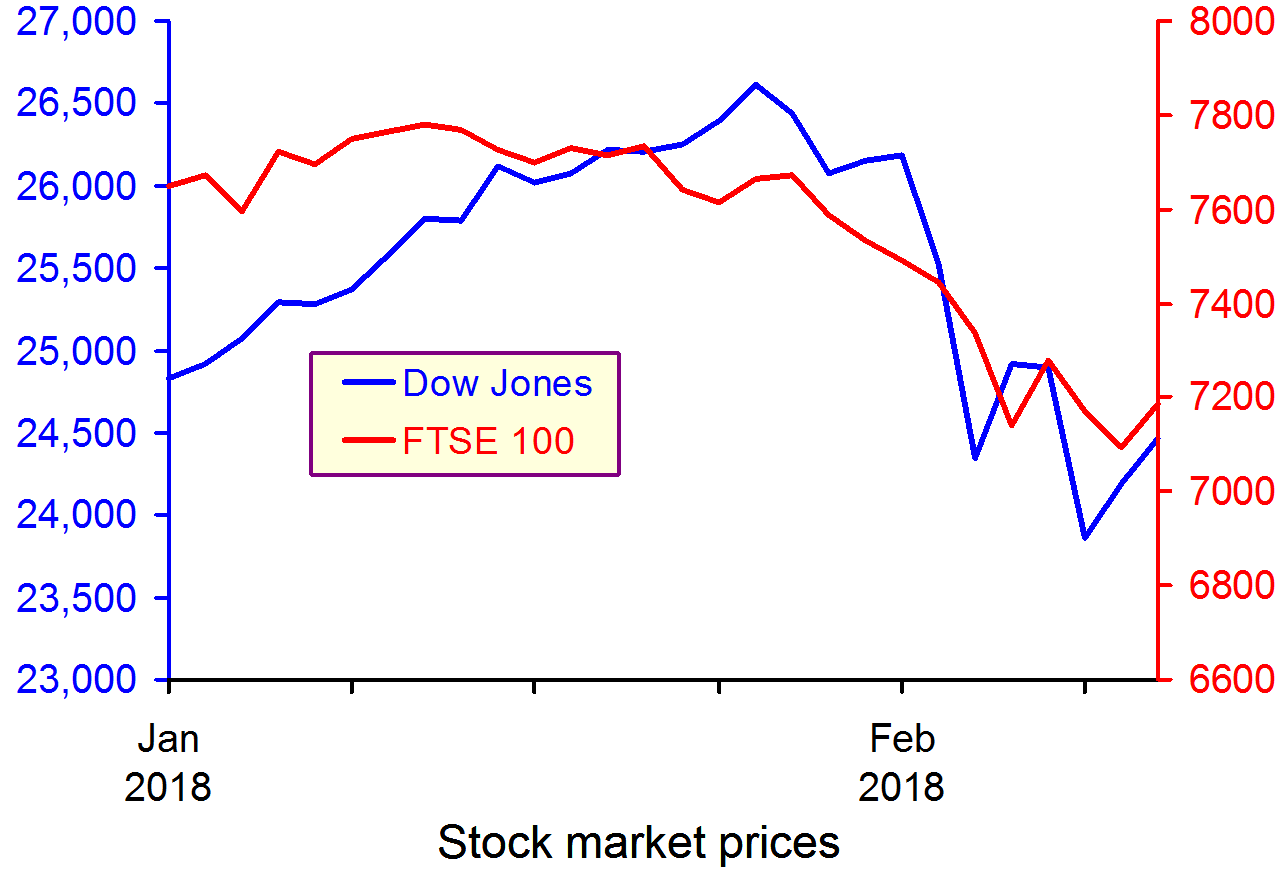
 These statements have coincided with a week of sharp corrections and turbulence in the world’s largest capital markets, as investors become increasingly conscious of the threat of rising inflation – and the possibility of tighter monetary policy.
The Dow Jones plunged from an all-time high of 26,186 points on 1 February to 23,860 a week later – losing more than 10 per cent of its value in just five trading sessions (suffering a 4.62 percentag fall on 5 February alone – the worst one-day point fall since 2011). European and Asian markets followed suit, with the FTSE-100, DAX and NIKKEI all suffering heavy losses in excess of 5 per cent over the same period.
 But why should higher inflationary expectations fuel a sell-off in global capital markets? After all, what firm wouldn’t like to sell its commodities at a higher price? Well, that’s not entirely true. Investors know that further increases in inflation are likely to be met by central banks hiking interest rates. This is because central banks are unlikely to be willing or able to allow inflation rates to rise much above their target levels.
The Bank of England, for instance, sets itself an inflation target of 2%. The actual ongoing rate of inflation reported in the latest quarterly Inflation Report is 3% (50 per cent higher than the target rate).
Any increase in interest rates is likely to have a direct impact on both the demand and the supply side of the economy.
Consumers (the demand side) would see their cost of borrowing increase. This could put pressure on households that have accumulated large amounts of debt since the beginning of the recession and could result in lower consumer spending.
Firms (the supply side) are just as likely to suffer higher borrowing costs, but also higher operational costs due to rising wages – both of which could put pressure on profit margins.
It now seems more likely that we are coming towards the end of the post-2008 era – a period that saw the cost of money being driven down to unprecedentedly low rates as the world’s largest economies dealt with the aftermath of the Great Recession.
For some, this is not all bad news – as it takes us a step closer towards a more historically ‘normal’ equilibrium. It remains to be seen how smooth such a transition will be and to what extent the high-leveraged world economy will manage to keep its current pace, despite the increasingly hawkish stance in monetary policy by the world’s biggest central banks.
Video
 Dow plunges 1,175 – worst point decline in history CNN Money, Matt Egan (5/2/18)
Articles
Global Markets Shed $5.2 Trillion During the Dow’s Stock Market Correction Fortune, Lucinda Shen (9/2/18)
Bank of England warns of larger rises in interest rates Financial Times, Chris Giles and Gemma Tetlow (8/2/18)
Stocks are now in a correction — here’s what that means Business Insider, Andy Kiersz (8/2/18)
US economy adds 200,000 jobs in January and wages rise at fastest pace since recession Business Insider, Akin Oyedele (2/2/18)
Questions
- Using supply and demand diagrams, explain the likely effect of an increase in interest rates to equilibrium prices and output. Is it good news for investors and how do you expect them to react to such hikes? What other factors are likely to influence the direction of the effect?
- Do you believe that the current ultra-low interest rates could stay with us for much longer? Explain your reasoning.
- What is likely to happen to the exchange rate of the pound against the US dollar, if the Bank of England increases interest rates first?
- Why do stock markets often ‘overshoot’ in responding to expected changes in interest rates or other economic variables
 These are challenging times for business. Economic growth has weakened markedly over the past 18 months with output currently growing at an annual rate of around 1.5 per cent, a percentage point below the long-term average. Spending power continues to be squeezed, with the annual rate of inflation in October reported to be running at 3.1 per cent compared to annual earnings growth of 2.5 per cent (see the squeeze continues). Moreover, consumer confidence remains fragile with households continuing to express particular concerns about the general economy and unemployment.
Here, we update our blog of July 2016 which, following the UK vote to leave the European Union, noted the fears for UK growth as confidence fell sharply. Consumer confidence is frequently identified by macro-economists as an important source of economic volatility. Indeed many macro models use a change in consumer confidence as a means of illustrating how economic shocks affect a range of macro variables, including growth, employment and inflation. Many economists agree that, in the short term at least, falling levels of confidence adversely affect activity because aggregate demand falls as households spend less.
The European Commission’s confidence measure is collated from questions in a monthly survey. In the UK around 2000 individuals are surveyed. Across the EU as a whole over 41 000 people are surveyed. In the survey individuals are asked a series of 12 questions which are designed to provide information on spending and saving intentions. These questions include perceptions of financial well-being, the general economic situation, consumer prices, unemployment, saving and the undertaking of major purchases.
The responses elicit either negative or positive responses. For example, respondents may feel that over the next 12 months the financial situation of their household will improve a little or a lot, stay the same or deteriorate a little or a lot. A weighted balance of positive over negative replies can be calculated. The balance can vary from -100, when all respondents choose the most negative option, to +100, when all respondents choose the most positive option.
The European Commission’s principal consumer confidence indicator is the average of the balances of four of the twelve questions posed: the financial situation of households, the general economic situation, unemployment expectations (with inverted sign) and savings, all over the next 12 months. These forward-looking balances are seasonally adjusted. The aggregate confidence indicator is thought to track developments in households’ spending intentions and, in turn, likely movements in the rate of growth of household consumption.

Chart 1 shows the consumer confidence indicator for the UK. The long-term average of –8.6 shows that negative responses across the four questions typically outweigh positive responses. In November 2017 the confidence balance stood at -5.2 roughly on par with its value in the previous two months, though marginally up on values of close to -7 over the summer. However, as recently as the beginning of 2016 the aggregate confidence score was running at around +4. In this context, current levels do constitute a significant change in consumer sentiment, changes which do ordinarily mark similar turning points in economic activity.(Click here to download a PowerPoint of the chart.)

Chart 2 allows to look behind the European Commission’s headline confidence indicator for the UK by looking at its four component balances. From it, we can see a deterioration in all four components. However, by far the most significant change in the individual confidence balances has been the sharp deterioration in expectations for the general economy. In November the forward-looking general economic situation stood at -25.5, compared to its long-run average of -11.6. (Click here to download a PowerPoint of the chart.)
 The fall in UK consumer confidence is even more stark when compared to developments in consumer confidence across the whole of the European Union and in the 19 countries that make up the Euro area. Chart 3 shows how UK consumer confidence recovered relatively more strongly following the financial crisis of the late 2000s. The headline confidence indicator rose strongly from the middle of 2013 and was consistently in positive territory during 2014, 2015 and into 2016. The fall in consumer confidence in the UK has seen the headline confidence measure fall below that for the EU and the euro area. (Click here to download a PowerPoint of the chart.)
Consumer (and business) confidence is closely linked to uncertainty. The circumstances following the UK vote to leave the EU have undoubtedly created the conditions for acute uncertainty. Uncertainty breeds caution. Economists sometimes talk about spending being affected by two conflicting motives: prudence and impatience. While impatience creates a desire for spending now, prudence pushes us towards saving and insuring ourselves against uncertainty and unforeseen events. The worry is that the twin forces of fragile confidence and squeezed real earning are weighting heavily in favour of prudence and patience (a reduction in impatience). Going forward, this could create the conditions for a sustained period of subdued growth which, if it were to impact heavily on firms’ investment plans, could adversely impact on the economy’s productive potential. The hope is that the Brexit negotiations can move apace to reduce uncertainty and limit uncertainty’s adverse impact on economic activity.
Articles
UK consumer confidence slips in December – Thomson Reuters/Ipsos Reuters (14/12/17)
UK consumer confidence drops to lowest level since Brexit result Independent, Ben Chu (30/11/17)
2017 set to be worst year for UK consumer spending since 2012, Visa says Independent, Josie Cox, (11/12/17)
Carpetright boss warns of ‘fragile’ consumer confidence after profits plunge Telegraph, Jack Torrance (12/12/17)
UK consumers face sharpest price rise in services for nearly a decade Guardian, Richard Partington (5/12/17)
UK average wage growth undershoots inflation again squeezing real incomes Independent, Josie Cox (13/12/17)
Bank sees boost from Brexit progress BBC News (14/12/17)
Data
Business and Consumer Surveys European Commission
Questions
- Draw up a series of factors that you think might affect consumer confidence.
- Explain what you understand by a positive and a negative demand-side shock. How might changes in consumer confidence generate demand shocks?
- Analyse the ways in which consumer confidence might affect economic activity.
- Which of the following statements is likely to be more accurate: (a) Consumer confidence drives economic activity or (b) Economic activity drives consumer confidence?
- What macroeconomic indicators would those compiling the consumer confidence indicator expect the indicator to predict?
- Analyse the possible short-term and longer-term economic implications of a fall in consumer confidence.
- How might uncertainty affect consumer confidence?
- What do the concepts of impatience and prudence mean in the context of consumer spending? When consumer confidence falls which of these might become more significant for consumer spending?
 UK CPI inflation rose to 3.1% in November. This has forced Mark Carney to write a letter of explanation to the Chancellor – something he is required to do if inflation is more than 1 percentage point above (or below) the target of 2%.
The rise in inflation over the past few months has been caused largely by the depreciation of sterling following the Brexit vote. But there have been other factors at play too. The dollar price of oil has risen by 32% over the past 12 months and there have been large international rises in the price of metals and, more recently, in various foodstuffs. For example, butter prices have risen by over 20% in the past year (although they have declined somewhat recently). Other items that have seen large price rises include books, computer games, clothing and public transport.
The rate of CPI inflation is the percentage increase in the consumer prices index over the previous 12 months. When there is a one-off rise in prices, such as a rise in oil prices, its effect on inflation will only last 12 months. After that, assuming the price does not rise again, there will be no more effect on inflation. The CPI will be higher, but inflation will fall back. The effect may not be immediate, however, as input price changes take a time to work through supply chains.
Given that the main driver of inflation has been the depreciation in sterling, once the effect has worked through in terms of higher prices, inflation will fall back. Only if sterling continued depreciating would an inflation effect continue. So, many commentators are expecting that the rate on inflation will soon begin to fall.
 But what will have been the effect on real incomes? In the past 12 months, nominal average earnings have risen by around 2.5% (the precise figures will not be available for a month). This means that real average earnings have fallen by around 0.6%. (Click here for a PowerPoint of the chart.)
For many low-income families the effect has been more severe. Many have seen little or no increase in their pay and they also consume a larger proportion of items whose prices have risen by more than the average. Those on working-age benefits will be particularly badly hit as benefits have not risen since 2015.
If inflation does fall and if real incomes no longer fall, people will still be worse off unless real incomes rise back to the levels they were before they started falling. That could be some time off.
Articles
UK inflation rate at near six-year high BBC News (12/12/17)
Inflation up as food costs jump – and gas crisis threatens worse to come The Telegraph, Tim Wallace (12/12/17)
UK worst for pay growth as rich world soars ahead in 2018 The Telegraph, Tim Wallace (12/12/17)
Inflation rises to 3.1%, adding to UK cost of living squeeze The Guardian, Larry Elliott (12/12/17)
UK inflation breaches target as it climbs to 3.1% Financial Times, Gavin Jackson (12/12/17)
Inflation surges to 3.1% in November, a near six-year high Belfast Telegraph (12/12/17)
Data
CPI annual rate of increase (all items) ONS: series D7G7
Average weekly earnings, annual (3-month average) ONS: series KAC3
UK consumer price inflation: November 2017 ONS Statistical Bulletin (12/12/17)
Commodity prices Index Mundi
Questions
- Apart from CPI inflation, what other measures of inflation are there? Explain their meaning.
- Why is inflation of 2%, rather than 0%, seen as the optimal rate by most central banks?
- Apart from the depreciation of sterling, what other effects is Brexit likely to have on living standards in the UK?
- What are the arguments for and against the government raising benefits by the rate of CPI inflation?
- If Europe and the USA continue to grow faster than the UK, what effect is this likely to have on the euro/pound and dollar/pound exchange rates? What determines the magnitude of this effect?
- Unemployment is at its lowest level since 1975. Why, then, are real wages falling?
- Why, in the light of inflation being above target, has the Bank of England not raised Bank Rate again in December (having raised it from 0.25% to 0.5% in November)?
 According to a new report, Time for Change published by the Institute for Public Policy Research (IPPR), ‘The British economic model needs fundamental reform.’
It is no longer generating rising earnings for a majority of the population, and young people today are set to be poorer than their parents. Beneath its headlines figures, the economy is suffering from deep and longstanding weaknesses, which make it unfit to face the challenges of the 2020s.
The report by the IPPR’s Commission on Economic Justice is an interim one, with the final report due in the latter part of next year. The commission was set up in 2016 and includes business leaders, such as the heads of John Lewis and Siemens, the TUC General Secretary, the Archbishop of Canterbury and other leading figures.
Commenting on the interim report, Justin Welby, the Archbishop of Canterbury said
Our economic model is broken. Britain stands at a watershed moment where we need to make fundamental choices about the sort of economy we need. We are failing those who will grow up into a world where the gap between the richest and poorest parts of the country is significant and destabilising
The report found that wages have stagnated for the majority of the population since the financial crisis of 2007/8. Wage income has fallen as a proportion of national income, while the proportions going to income from profits and property have risen. Young people are poorer than previous generations of young people.
Despite low unemployment, many people are on zero-hour contracts, part-time contracts or employed on a casual basis. For many, their jobs are insecure and they have no bargaining power.
 The UK for many years has had a lower rate of investment that other developed economies and productivity, in terms of output per hour, is the lowest of its major competitors. Productivity in Germany is 36% higher than in the UK; in France and the USA it is 29% higher. Although there are some internationally competitive UK firms with high productivity, the country has:
a longer ‘tail’ of low-productivity businesses, in which weak management and poor use of skills leads to ‘bad jobs’ and low wages.
There are many other challenges, including an ageing population, uncertainties from Brexit, a large current account deficit, increased competition from abroad and growth once more in private-sector debt, which means that consumption may cease to be the main driver of economic growth as people seek to curb their borrowing.
The report is also critical of fiscal policy, which with record low interest rates could have been used to finance infrastructure projects as well as supporting public services.
The report recommends three approaches:
The first is institutional reform to support investment.
The second is making the economy more competitive through a coherent industrial strategy, reform of the financial sector to support long-term investment, reform of corporate governance to promote business success and tackling the market dominance of companies such as Amazon and Google.
The third is to bring greater social justice and equality through encouraging more secure and better-paid jobs, strengthening trades unions and reforming the tax system to make it fairer and smarter.
Not surprisingly the government has defended its record of reducing debt, presiding over falling unemployment and reduced inequality as measured by a reduced Gini coefficient. However, there has only been a modest fall in the Gini coefficient, from 0.333 in 2009/10 to 0.315 in 2016/7, and this has largely been the result of the very rich seeing a decline in income from assets.
Articles
Britain’s economy is broken and failing to tackle inequality, says major new report Independent, Ben Chu (6/9/17)
UK’s economic model is broken, says Archbishop of Canterbury The Guardian, Phillip Inman (5/9/17)
Tax wealth or see the UK tear itself apart, Cable will warn Bloomberg, Alex Morales and Thomas Penny (6/9/17)
Archbishop of Canterbury calls for radical economic reform BBC News (5/9/17)
Archbishop warns economy is “broken” as report reveals longest period of wage stagnation for 150 years Huffington Post, Rachel Wearmouth (6/9/17)
Britain’s economy is broken. We desperately need new ideas The Guardian, Tom Kibasi (4/6/17)
Carney: Britain is in the ‘first lost decade since the 1860s’, Business Insider, Oscar Williams-Grut (6/12/16)
Our broken economy, in one simple chart New York Times, David Leonhardt (7/8/16)
Report
Time for Change: A new Vision for the British Economy IPPR Commission on Economic Justice (6/9/17)
Questions
- Why have wages for the majority of the UK population stagnated for the past 10 years?
- Why is productivity in the UK lower than in most other developed economies?
- Is it possible for poor people to become poorer and yet for the Gini coefficient to fall?
- What institutional reforms would you suggest to encourage greater investment?
- Explain the possible advantages and disadvantages of abandoning ‘austerity policy’ and adopting a more expansionist fiscal stance?
- Does it matter that Amazon and Google are dominant players in their respective markets? Explain.
On the 15th June, the Bank of England’s Monetary Policy Committee decided to keep Bank Rate on hold at its record low of 0.25%. This was not a surprise – it was what commentators had expected. What was surprising, however, was the split in the MPC. Three of its current eight members voted to raise the rate.
At first sight, raising the rate might seem the obvious thing to do. CPI inflation is currently 2.9% – up from 2.7% in April and well above the target of 2% – and is forecast to go higher later this year. According to the Bank of England’s own forecasts, even at the 24-month horizon inflation is still likely to be a little above the 2% target.
Those who voted for an increase of 0.25 percentage points to 0.5% saw it as modest, signalling only a very gradual return to more ‘normal’ interest rates. However, the five who voted to keep the rate at 0.25% felt that it could dampen demand too much.

The key argument is that inflation is not of the demand-pull variety. Aggregate demand is subdued. Real wages are falling and hence consumer demand is likely to fall too. Thus many firms are cautious about investing, especially given the considerable uncertainties surrounding the nature of Brexit. The prime cause of the rise in inflation is the fall in sterling since the Brexit vote and the effect of higher import costs feeding through into retail prices. In other words, the inflation is of the cost-push variety. In such cirsumstances dampening demand further by raising interest rates would be seen by most economists as the wrong response. As the minutes of the MPC meeting state:
Attempting to offset fully the effect of weaker sterling on inflation would be achievable only at the cost of higher unemployment and, in all likelihood, even weaker income growth. For this reason, the MPC’s remit specifies that, in such exceptional circumstances, the Committee must balance any trade-off between the speed at which it intends to return inflation sustainably to the target and the support that monetary policy provides to jobs and activity.
The MPC recognises that the outlook is uncertain. It states that it stands ready to respond to circumstances as they change. If demand proves to be more resilient that it currently expects, it will raise Bank Rate. If not, it is likely to keep it on hold to continue providing a modest stimulus to the economy. However, it is unlikely to engage in further quantitative easing unless the economic outlook deteriorates markedly.
Articles
The Bank of England is moving closer to killing the most boring chart in UK finance right now Business Insider, Will Martin (16/6/17)
UK inflation hits four-year high of 2.9% Financial Times, Gavin Jackson and Chloe Cornish (13/6/17)
Surprise for markets as trio of Bank of England gurus call for interest rates to rise The Telegraph, Szu Ping Chan Tim Wallace (15/6/17)
Bank of England rate setters show worries over rising inflation Financial TImes, Chris Giles (15/6/17)
Three Bank of England policymakers in shock vote for interest rate rise Independent, Ben Chu (15/6/17)
Bank of England edges closer to increasing UK interest rates The Guardian, Katie Allen (15/6/17)
Bank of England doves right to thwart hawks seeking interest rate rise The Guardian, Larry Elliott (15/6/17)
Haldane expects to vote for rate rise this year BBC News (21/6/17)
Bank of England documents
Monetary policy summary Bank of England (15/6/17)
Monetary Policy Summary and minutes of the Monetary Policy Committee meeting ending on 14 June 2017 Bank of England (15/6/17)
Inflation Report, May 2017 Bank of England (11/5/16)
Questions
- What is the mechanism whereby a change in Bank Rate affects other interest artes?
- Use an aggregate demand and supply diagram to illustrate the difference between demand-pull and cost-push inflation.
- If the exchange rate remains at around 10–15% below the level before the Brexit vote, will inflation continue to remain above the Bank of England’s target, or will it reach a peak relatively soon and then fall back? Explain.
- For what reason might aggregate demand prove more buoyant that the MPC predicts?
- Would a rise in Bank Rate from 0.25% to 0.5% have a significant effect on aggregate demand? What role could expectations play in determining the nature and size of the effect?
- Why are real wage rates falling at a time when unemployment is historically very low?
- What determines the amount that higher prices paid by importers of products are passed on to consumers?
 On 8 February, the Bank of England issued a statement that was seen by many as a warning for earlier and speedier than previously anticipated increases in the UK base rate. Mark Carney, the governor of the Bank of England, referred in his statement to ‘recent forecasts’ which make it more likely that ‘monetary policy would need to be tightened somewhat earlier and by a somewhat greater extent over the forecast period than anticipated at the time of the November report’.
 These statements have coincided with a week of sharp corrections and turbulence in the world’s largest capital markets, as investors become increasingly conscious of the threat of rising inflation – and the possibility of tighter monetary policy.