One of the key questions about Brexit is its effect on UK trade and cross-border investment. Once outside the customs union, will the freedom to negotiate trade deals lead to an increase in UK exports and GDP, as many who support Brexit claim; or will the increased frictions in trade with the EU, and the need to negotiate new trade deals with those non-EU countries which already have trade deals with the EU, lead to a fall in exports and in GDP?
Also, how will trade restrictions or new trade deals affect capital flows? Will there be an increase in inward investment or a flight of investment to the EU or elsewhere? Will many companies relocate away from the UK – or to it?
Although there has been a cost up to now from the Brexit vote, in terms of a depreciation in sterling and a fall in inward investment (see the first article below), the future effects have been hard to predict as the terms on which the UK will leave the EU have been unclear. However, with a draft withdrawal agreement between the EU and the UK government having been reached, the costs and benefits are becoming clearer. But there is still uncertainty about just what the effects on trade and investment will be.
- First, the 585-page draft withdrawal agreement is not a trade deal. It contains details of UK payments to the EU, commitments on the rights of EU and UK citizens and confirmation of the transition period – initially until 31 December 2020, but possibly extended with mutual agreement. During the transition agreement, the UK would remain a member of the customs union and single market and remain subject to rulings of the European Court of Justice. The withdrawal agreement also provides for a continuation of the customs union beyond the transition period, if no long-term trade agreement is in place. This is to prevent he need for a hard border between Ireland and Northern Ireland.
- Second, there is merely a 26-page ‘political declaration‘ about future trade relations. Negotiations on the details of these can only begin once the UK has left the EU, scheduled for 29 March 2019. So it’s still unclear about just how free trade in both goods and services will be between the UK and the EU and how freely capital and labour will move between them. But with the UK outside the single market, there will be some limitations on trade and factor movements – some frictions.
 Third, it is not clear whether the UK Parliament will agree to the withdrawal agreement. Currently, it seems as if a majority of MPs is in favour of rejecting it. If this happens, will the UK leave without an agreement, with trade based on WTO terms? Or will the EU be prepared to renegotiate it – something it currently says it will not do? Or will the issue be put back to the electorate in the form of a People’s vote (see also), which might contain the option of seeking to remain in the EU?
So, without knowing just what the UK’s future trade relations will be with (a) the EU, (b) non-EU countries which have negotiated trade deals with the EU, (c) other countries without trade deals with the EU, it is impossible to quantify the costs and benefits from the effects on trade and investment. However, the consensus among economists is still that there will be a net cost in terms of lost trade and inward investment.
Such as view is backed by a government analysis of various Brexit scenarios, released in time for the House of Commons vote on 11 December. This concludes that the UK will be worse off under all Brexit alternatives compared with staying in the EU. The main brake on growth will be frictions in trade from tariff and non-tariff barriers.
This analysis was supported by a Bank of England paper which modelled various scenarios based on assumptions about different types of Brexit deal. While recognising the inherent uncertainty in some of the empirical relationships, it still concluded that Brexit would be likely to have a net negative effect. The size of this negative effect would depend on the closeness of the new relationship between the UK and EU, the degree of preparedness across firms and critical infrastructure, and how other policies respond.
Articles
Reports
Documents
Questions
- Identify the main economic advantages and disadvantages for the UK from leaving the EU?
- How does the law of comparative advantage relate to the question of the relative trade gains from leaving and remaining in the EU?
- What is the difference between the following models of relationship with the EU: the Switzerland model; the Norway model; the Turkey model; the Canada (plus or plus, plus) model; trading on WTO terms?
- Why is the consensus among economists that there will be a net economic cost from leaving the EU, no matter on what terms?
- Is the UK likely to achieve more favourable trade deals with non-EU countries as an independent country or as a member of the EU benefiting from EU-negotiated trade deals with such countries?
 The IMF has just published its six-monthly World Economic Outlook. This provides an assessment of trends in the global economy and gives forecasts for a range of macroeconomic indicators by country, by groups of countries and for the whole world.
This latest report is upbeat for the short term. Global economic growth is expected to be around 3.9% this year and next. This represents 2.3% this year and 2.5% next for advanced countries and 4.8% this year and 4.9% next for emerging and developing countries. For large advanced countries such rates are above potential economic growth rates of around 1.6% and thus represent a rise in the positive output gap or fall in the negative one.
But while the near future for economic growth seems positive, the IMF is less optimistic beyond that for advanced countries, where growth rates are forecast to decline to 2.2% in 2019, 1.7% in 2020 and 1.5% by 2023. Emerging and developing countries, however, are expected to see growth rates of around 5% being maintained.
For most countries, current favorable growth rates will not last. Policymakers should seize this opportunity to bolster growth, make it more durable, and equip their governments better to counter the next downturn.
By comparison with other countries, the UK’s growth prospects look poor. The IMF forecasts that its growth rate will slow from 1.8% in 2017 to 1.6% in 2018 and 1.5% in 2019, eventually rising to around 1.6% by 2023.  The short-term figures are lower than in the USA, France and Germany and reflect ‘the anticipated higher barriers to trade and lower foreign direct investment following Brexit’.
The report sounds some alarm bells for the global economy.
The first is a possible growth in trade barriers as a trade war looms between the USA and China and as Russia faces growing trade sanctions. As Christine Lagarde, managing director of the IMF told an audience in Hong Kong:
Governments need to steer clear of protectionism in all its forms. …Remember: the multilateral trade system has transformed our world over the past generation. It helped reduce by half the proportion of the global population living in extreme poverty. It has reduced the cost of living, and has created millions of new jobs with higher wages. …But that system of rules and shared responsibility is now in danger of being torn apart. This would be an inexcusable, collective policy failure. So let us redouble our efforts to reduce trade barriers and resolve disagreements without using exceptional measures.
 The second danger is a growth in world government and private debt levels, which at 225% of global GDP are now higher than before the financial crisis of 2007–9. With Trump’s policies of tax cuts and increased government expenditure, the resulting rise in US government debt levels could see some fiscal tightening ahead, which could act as a brake on the world economy. As Maurice Obstfeld , Economic Counsellor and Director of the Research Department, said at the Press Conference launching the latest World Economic Outlook:
Debts throughout the world are very high, and a lot of debts are denominated in dollars. And if dollar funding costs rise, this could be a strain on countries’ sovereign financial institutions.
In China, there has been a massive rise in corporate debt, which may become unsustainable if the Chinese economy slows. Other countries too have seen a surge in private-sector debt. If optimism is replaced by pessimism, there could be a ‘Minsky moment’, where people start to claw down on debt and banks become less generous in lending. This could lead to another crisis and a global recession. A trigger could be rising interest rates, with people finding it hard to service their debts and so cut down on spending.
The third danger is the slow growth in labour productivity combined with aging populations in developed countries. This acts as a brake on growth. The rise in AI and robotics (see the post Rage against the machine) could help to increase potential growth rates, but this could cost jobs in the short term and the benefits could be very unevenly distributed.
 This brings us to a final issue and this is the long-term trend to greater inequality, especially in developed economies. Growth has been skewed to the top end of the income distribution. As the April 2017 WEO reported, “technological advances have contributed the most to the recent rise in inequality, but increased financial globalization – and foreign direct investment in particular – has also played a role.”
And the policy of quantitative easing has also tended to benefit the rich, as its main effect has been to push up asset prices, such as share and house prices. Although this has indirectly stimulated the economy, it has mainly benefited asset owners, many of whom have seen their wealth soar. People further down the income scale have seen little or no growth in their real incomes since the financial crisis.
Articles
- Clouds gather over global economy, casting long shadow on Europe
Politico, Pierre Briançon (18/4/18)
- IMF warns rising trade tensions threaten to derail global growth
Reuters, David Lawder (17/4/18)
- IMF outlook contains cause for celebration but a horrendous hangover is looming
The Guardian, Greg Jericho (18/4/18)
- World trade system in danger of being torn apart, warns IMF
The Guardian, Larry Elliott (17/4/18)
- IMF Warns of Rising Threats to Global Financial System
Bloomberg, Andrew Mayeda (18/4/18)
- IMF issues warning on global debt
BBC News, Andrew Walker (18/4/18)
- The IMF has a simple message: the global recovery will peter out
The Guardian, Larry Elliott (17/4/18)
- Global growth is built, alas, on shaky foundations
The Irish Times, Martin Wolf (18/4/18)
- Government debt
The Economist (19/4/18)
- This Is How Much Money the World Owes
Fortune (19/4/18)
Report
Data
Questions
- For what reasons may the IMF forecasts turn out to be incorrect?
- Why are emerging and developing countries likely to experience faster rates of economic growth than advanced countries?
- What are meant by a ‘positive output gap’ and a ‘negative output gap’? What are the consequences of each for various macroeconomic indicators?
- Explain what is meant by a ‘Minsky moment’. When are such moments likely to occur? Explain why or why not such a moment is likely to occur in the next two or three years?
- For every debt owed, someone is owed that debt. So does it matter if global public and/or private debts rise? Explain.
- What have been the positive and negative effects of the policy of quantitative easing?
- What are the arguments for and against using tariffs and other forms of trade restrictions as a means of boosting a country’s domestic economy?
 Senior Bank of England officials appeared before the House of Commons’ Treasury Select Committee on 21 February to report on the state of the economy and the future path for inflation and interest rates. One topic considered was the role of depreciation.
The pound has depreciated since the referendum on EU membership in June 2016. The exchange rate index today is some 9% below that before the referendum and 15% below the peak a year before the referendum.
It had fallen as much as 14% by October 2016 below the level before the referendum and 20% below its peak, pushed down partly by the cut in Bank Rate from 0.5% to 0.25% following the referendum. In November 2017, the Bank’s Monetary Policy Committee raised Bank Rate back to 0.5%. Two or three more rises of 25 basis points are expected over the next couple of years. This has helped to strengthen sterling somewhat. (Click here for a PowerPoint of the chart below.)
But has the depreciation been advantageous or disadvantageous to the economy? Here the Governor (Mark Carney) and the Chief Economist (Andy Haldane) appeared to differ. Andy Haldane said:
A combination of the weaker pound and a stronger global economy has worked its magic. That has meant that net trade has been a significant contributor, and we expect those effects to continue over the next two or three years. … Depreciations work, and that’s how they work.
By contrast, Mark Carney said:
Depreciations don’t work. They have an economic effect, but they’re not a good economic strategy. They may be an outcome of various things … but it’s how you make yourself poorer.
Are these statements contradictory or are they simply emphasising different effects of depreciation?

Both Andy Haldane and Mark Carney would accept that a depreciation makes imports more expensive and thus reduces real incomes (at least in the short run). They would also accept that a depreciation makes exports priced in pounds cheaper in foreign currency terms and thus can boost the demand for exports.
There is disagreement over two things, however. The first is the effect on people’s real incomes in the long run. Will any fall in real incomes from higher-priced imports in the short run be offset in the long run by higher economic growth?
This relates to a second area of disagreement. This is whether a depreciation can act as a significant driver for exports over the longer term. The increased incentive on the demand side (from consumers abroad to buy UK exports) could be offset by a disincentive for exporters to become more efficient and/or to compete in terms of quality. In other words, although it can give exporters a price advantage, the crucial question is the extent to which they take advantage of this, or merely take higher profits.
The disagreements thus relate primarily to the incentive effects over the longer term.
Articles
Bank of England governor says Brexit has made us poorer – as it happened The Guardian, Graeme Wearden (21/2/18)
Brexit will knock 5% off wage growth, says Mark Carney The Guardian, Phillip Inman (21/2/18)
Video
 Treasury Committee: Wednesday 21 February 2018 Parliamentlive.tv (21/2/18) (see from 16:08:00)
Bank of England documents
Treasury Select Committee hearing on the February 2018 Inflation Report Bank of England (21/2/18)
Inflation Report – February 2018 Bank of England (8/2/18)
Data
Interest & exchange rates data Bank of England
Questions
- How does a depreciation affect the demand for and supply of imports and exports?
- What determines the size of the effect on inflation of a depreciation?
- What is the significance of the price elasticity of demand for and supply of sterling in determining the size of depreciation resulting from a change in confidence or a change in interest rates?
- How does productivity growth impact on the effectiveness of a depreciation in leading to higher economic growth?
- In what ways might a depreciation affect productivity growth?
 On 8 February, the Bank of England issued a statement that was seen by many as a warning for earlier and speedier than previously anticipated increases in the UK base rate. Mark Carney, the governor of the Bank of England, referred in his statement to ‘recent forecasts’ which make it more likely that ‘monetary policy would need to be tightened somewhat earlier and by a somewhat greater extent over the forecast period than anticipated at the time of the November report’.
A similar picture emerges on the other side of the Atlantic. With labour markets continuing to deliver spectacularly high rates of employment (the highest in the last 17 years), there are also now signs that wages are on an upward trajectory. According to a recent report from the US Bureau of Labor Statistics, US wage growth has been stronger than expected, with average hourly earnings rising by 2.9 percent – the strongest growth since 2009.
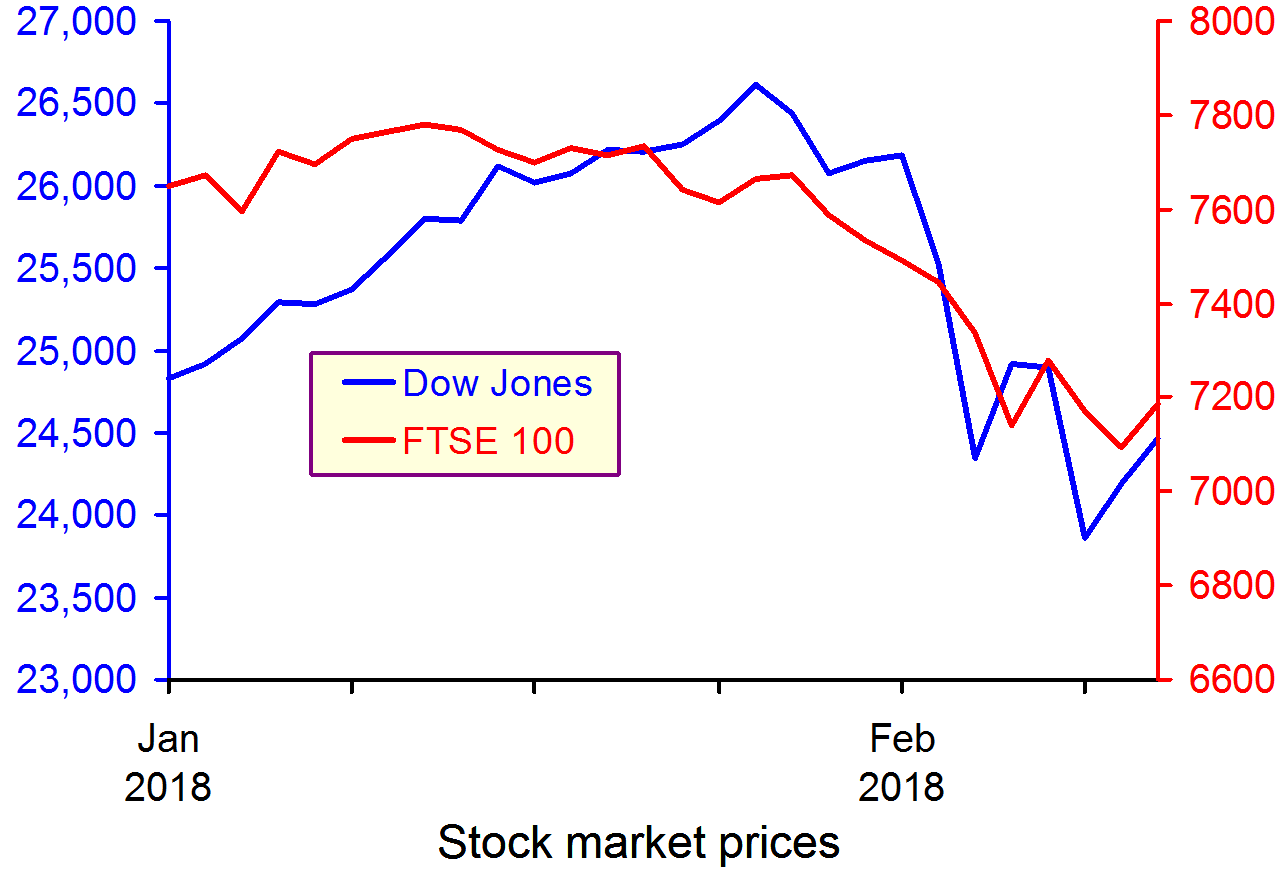
 These statements have coincided with a week of sharp corrections and turbulence in the world’s largest capital markets, as investors become increasingly conscious of the threat of rising inflation – and the possibility of tighter monetary policy.
The Dow Jones plunged from an all-time high of 26,186 points on 1 February to 23,860 a week later – losing more than 10 per cent of its value in just five trading sessions (suffering a 4.62 percentag fall on 5 February alone – the worst one-day point fall since 2011). European and Asian markets followed suit, with the FTSE-100, DAX and NIKKEI all suffering heavy losses in excess of 5 per cent over the same period.
 But why should higher inflationary expectations fuel a sell-off in global capital markets? After all, what firm wouldn’t like to sell its commodities at a higher price? Well, that’s not entirely true. Investors know that further increases in inflation are likely to be met by central banks hiking interest rates. This is because central banks are unlikely to be willing or able to allow inflation rates to rise much above their target levels.
The Bank of England, for instance, sets itself an inflation target of 2%. The actual ongoing rate of inflation reported in the latest quarterly Inflation Report is 3% (50 per cent higher than the target rate).
Any increase in interest rates is likely to have a direct impact on both the demand and the supply side of the economy.
Consumers (the demand side) would see their cost of borrowing increase. This could put pressure on households that have accumulated large amounts of debt since the beginning of the recession and could result in lower consumer spending.
Firms (the supply side) are just as likely to suffer higher borrowing costs, but also higher operational costs due to rising wages – both of which could put pressure on profit margins.
It now seems more likely that we are coming towards the end of the post-2008 era – a period that saw the cost of money being driven down to unprecedentedly low rates as the world’s largest economies dealt with the aftermath of the Great Recession.
For some, this is not all bad news – as it takes us a step closer towards a more historically ‘normal’ equilibrium. It remains to be seen how smooth such a transition will be and to what extent the high-leveraged world economy will manage to keep its current pace, despite the increasingly hawkish stance in monetary policy by the world’s biggest central banks.
Video
Dow plunges 1,175 – worst point decline in history CNN Money, Matt Egan (5/2/18)
Articles
Global Markets Shed $5.2 Trillion During the Dow’s Stock Market Correction Fortune, Lucinda Shen (9/2/18)
Bank of England warns of larger rises in interest rates Financial Times, Chris Giles and Gemma Tetlow (8/2/18)
Stocks are now in a correction — here’s what that means Business Insider, Andy Kiersz (8/2/18)
US economy adds 200,000 jobs in January and wages rise at fastest pace since recession Business Insider, Akin Oyedele (2/2/18)
Questions
- Using supply and demand diagrams, explain the likely effect of an increase in interest rates to equilibrium prices and output. Is it good news for investors and how do you expect them to react to such hikes? What other factors are likely to influence the direction of the effect?
- Do you believe that the current ultra-low interest rates could stay with us for much longer? Explain your reasoning.
- What is likely to happen to the exchange rate of the pound against the US dollar, if the Bank of England increases interest rates first?
- Why do stock markets often ‘overshoot’ in responding to expected changes in interest rates or other economic variables
 With the Conservatives having lost their majority in Parliament in the recent UK election, there is renewed discussion of the form that Brexit might take. EU states are members of the single market and the customs union. A ‘hard Brexit’ involves leaving both and this was the government’s stance prior to the election. But there is now talk of a softer Brexit, which might mean retaining membership of the single market and/or customs union.
The single market
Belonging to the single market means accepting the free movement of goods, services, capital and labour. It also involves tariff-free trade within the single market and adopting a common set of rules and regulations over trade, product standards, safety, packaging, etc., with disputes settled by the European Court of Justice. Membership of the single market involves paying budgetary contributions. Norway and Iceland are members of the single market.
The single market brings huge benefits from free trade with no administrative barriers from customs checks and paperwork. But it would probably prove impossible to negotiate remaining in the single market with an opt out on free movement of labour. Controlling immigration from EU countries was a key part of the Leave campaign.
The customs union
This involves all EU countries adopting the same tariffs (customs duties) on imports from outside the EU. These tariffs are negotiated by the European Commission with non-EU countries  on a country-by-country basis. Goods imported from outside the EU are charged tariffs in the country of import and can then be sold freely around the EU with no further tariffs.
Remaining a member of the customs union would allow the UK to continue trading freely in the EU, subject to meeting various non-tariff regulations. It would also allow free ‘borderless’ trade between Northern Ireland and the Republic of Ireland. However, being a member of the customs union would prevent the UK from negotiating separate trade deals with non-EU countries. The ability to negotiate such deals has been argued to be one of the main benefits of leaving the EU.
Free(r) trade area
The UK could negotiate a trade deal with the EU. But it is highly unlikely that such a deal could be in place by March 2019, the date when the UK is scheduled to leave the EU. At that point, trade barriers would be imposed, including between the two parts of the island of Ireland. Such deals are very complex, especially in the area of services, which are the largest category of UK exports. Negotiating tariff-free or reduced-tariff trade is only a small part of the problem; the biggest part involves negotiating product standards, regulations and other non-tariff barriers.
All the above options thus involve serious problems and the government will be pushed from various sides, not least within the Conservative Party, for different degrees of ‘softness’ or ‘hardness’ of Brexit. What is more, the pressure from business for free trade with the EU is likely to grow. Brexit may mean Brexit, but just what form it will take is very unclear.
Articles
Free trade area, single market, customs union – what’s the difference? BBC News, Jonty Bloom (12/6/17)
Brexit: What are the options? BBC News (12/6/17)
After the election, the real test: Brexi The Economist (8/6/17)
May’s Ministers Plot Softer Brexit to Keep UK in Single Market Bloomberg, Tim Ross, Alex Morales and Svenja O’Donnell (11/6/17)
UK’s Hung Parliament Raises Business Hopes for a Softer Brexit Bloomberg, Stephanie Baker and James Paton (12/6/17)
Do not exaggerate the effect the election will have on Brexit Financial Times, Wolfgang Münchau (11/6/17)
What is soft Brexit? How could it work as UK negotiates leaving the EU? Independent, May Bulman (12/6/17)
Brexit-lite back on the table as Britain rethinks its options after election The Guardian, Dan Roberts (11/6/17)
Review plan to quit EU Customs Union, urges FTA FoodManufacture.co.uk, James Ridler (12/6/17)
Freight leaders urge government to review decision to leave EU customs union RTM (12/6/17)
Paper
Making Brexit work for British Business: Key Execution Priorities M-RCBG Associate Working Paper No. 77, Harvard Kennedy School, Peter Sands, Ed Balls, Sebastian Leape and Nyasha Weinberg (June 2017)
Questions
- Explain the trading agreement between Norway and the EU.
- How does the Norwegian arrangement with the EU differ from the Turkish one?
- What are meant by the terms ‘hard Brexit’ and ‘soft Brexit’?
- How does a customs union differ from a free trade area?
- Is it possible to have (a) a customs union without a single market; (b) a single market without a customs union?
- To what extent is it in the EU’s interests to negotiate a deal with the UK which lets it maintain access to the customs union without having free movement of labour?
- The EU insists that talks about future trading arrangements between the UK and the EU can take place only after sufficient progress has been made on the terms of the ‘divorce’. What elements are included in the divorce terms?
- If agreement is not reached by 29 March 2019, what happens and what would be the consequences?
- Will a hung parliament, or at least a government supported by the DUP on a confidence and supply basis, make it more or less likely that there will be a hard Brexit?
- For what reasons may the EU favour (a) a hard Brexit; (b) a soft Brexit?