The latest preliminary GDP estimates for 2014 Q1 suggest that the economy’s output (real GDP) expanded by 0.8 per cent following on the back of a 0.7 per cent increase in 2013 Q4. Growth was observed in three of the four main industrial sectors: 0.9% in services, 0.8% in production and 0.3% in construction. In contrast, output decreased by 0.7% in agriculture. The total output of the economy is now just 0.6 per cent below its 2008 Q1 peak with the output of the service sector now 2.0 per cent higher.
Data on growth need to be set in the context of the inherent volatility of economies and in this case in the context of 2008/9 recession. Then, output fall by some 7.2 per cent. UK output peaked in 2008 Q1 (£392.786 billion at 2010 prices). There then followed 6 quarters during which output declined.
Output declined again in 2010 Q4 (-0.2% growth), in 2011 Q4 (-0.1% growth), in 2012 Q2 (-0.4%) and in 2012 Q4 (-0.2%). A double-dip recession was only narrowly avoided with growth recorded at zero on 2012 Q1. The latest ONS numbers show the economy grew by 0.8 per cent in 2013 Q2 (to £381.318 billion at 2010 prices), by 0.8 per cent in 2013 Q3 (to £384.533 billion at 2010 prices), by 0.7 per cent in 2013 Q4 (to £387.138 billion at 2010 prices) and by 0.8 per cent in 2014 Q1 (to £390.235 billion at 2010 prices). Compared with 2013 Q1, the output of the UK economy in 2014 Q1 is 3.1 per cent higher.
 Chart 1 helps to put the recent growth numbers into an historical context. It shows the quarterly change in real GDP since the 1980s. We can see the 5-quarter recession that commenced in 1980 Q1 when output shrunk by 4.6 per cent, the 5-quarter recession that commenced in 1990 Q3 when output shrank by 2.4 per cent and the 6-quarter recession that commenced in 2008 Q2 when output shrank by 7.2 per cent. (Click here to download the chart to PowerPoint.)
 Chart 2 scratches a little below the surface by looking at output by the 4 principal industrial types. The interesting finding is that the output of the service sector has now risen above its 2008 Q1 peak. In 2014 Q1, service sector output was 2.0 per cent higher than 2008 Q1. The fact that total output remains 0.6 per cent lower can be explained by the lop-sided industrial recovery. Output in agriculture, forestry and fisheries remains 7.1 per cent lower, production (including manufacturing) 11.5 per cent lower and construction 12.2 per cent lower. (Click here to dowload the chart to Powerpoint.)
Data
Preliminary Estimate of GDP – Time Series Dataset Q1 2014 Office for National StatisticsGross Domestic Product Preliminary Estimate, Q1 2014 Office for National Statistics
Articles
UK GDP ‘close to pre-crisis level’ says NIESR BBC News (9/5/14)
UK ‘great recession’ almost over, says thinktank Guardian, Katie Allen (9/5/14)
UK economy tops its pre-crash high point, says NIESR Telegraph, Szu Ping Chan (9/5/14)
UK economy grew by 0.8% in first three months of 2014 Guardian, Katie Allen and Angela Monaghan (29/4/14)
Manufacturing is GDP star performer BBC News, Robert Peston (29/4/14).
Questions
- What is the difference between nominal and real GDP? Which of these helps to track changes in economic output?
- Looking at Chart 1 above, summarise the key patterns in real GDP since the 1980s.
- What is a recession? What is a double-dip recession?
- What are some of the problems with the traditional definition of a recession?
- Can a recession occur if nominal GDP is actually rising? Explain your answer.
- What factors lead to economic growth being so variable?
- What factors might explain the very different patterns seen since the late 2000s in the volume of output of the 4 main industrial sectors?
- Produce a short briefing paper exploring the prospects for economic growth in the UK over the next 12 to 18 months.
- Explain the arguments for and against using GDP as a measure of a country’s economic well-being.
- Analyse the role that the financial system might play in contributing to or alleviating the business cycle.
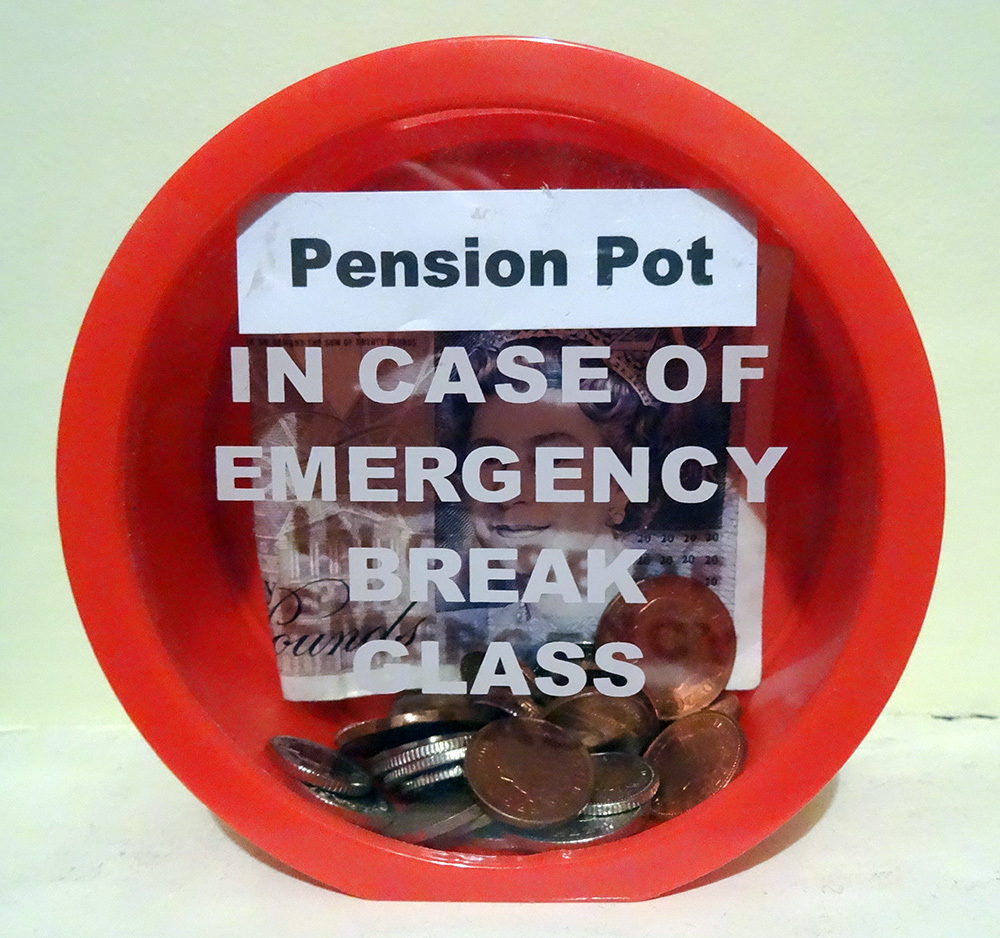
 Life expectancy is increasing across the world and the latest set of figures from the Office for National Statistics show that in the UK it has passed 79 for boys born in 2010–12, and 82 for girls born then. In fact the prediction is that over a third of babies born in 2013 will live to more than 100. The data throws up some interesting questions. How well prepared are we for lives that last this long? And how evenly distributed is this increase in life expectancy? Pensions’ minister, Steve Webb, has called for better information on life expectancy to be shared. How would this impact on our decision making?
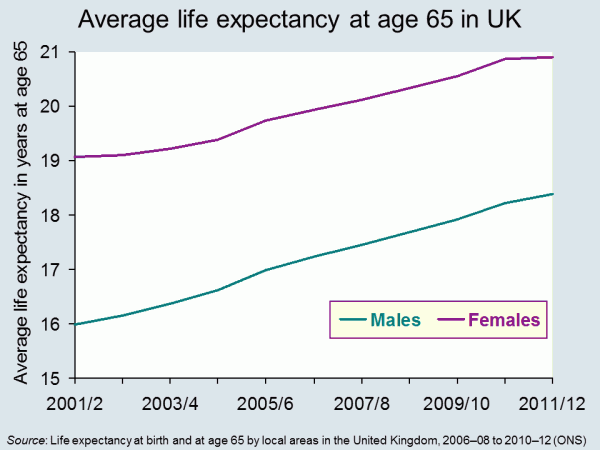
It seems reasonable to think that increasing life expectancy must be good news. And of course, for individuals it can be. In 1951 the average man retiring at 65, in England and Wales, could expect to live and draw a pension for another 12.1 years. By 2014 this had risen to 22 years.
 But while we can look forward to longer life, for the government, it presents some challenges The first is that we just don’t save enough for our old age. This seems to be partly because we find it hard to make decisions that will have an impact so far in the future. There are a number of measures that have been put in place to encourage us to save more, including auto-enrolment into company pension schemes. This is being rolled out across businesses over the next three years. In the 2014 Budget, the Chancellor announced that people reaching retirement age will be able to draw all their pension as a cash lump sum, rather than having to take it as a regular income.
Another concern for government is the variations that we find in life expectancy across the UK. The 2014 ONS data identified that life expectancy for men born in Glasgow in 2012 is 72.6, in East Dorset it is 82.9. 25% of those in Glasgow are not expected to live to 65. The gap in years of good health is even greater. This presents governments with a long-term problem. How do they achieve greater equality in this instance? Do they focus resources on the areas that need it most? Do they legislate to address behaviour? Or do they rely on the provision of good advice – on diet, exercise and other factors?
Information has a role to play in both areas identified above. In April 2014, Steve Webb, suggested that in order to make good decisions at the point of retirement, people need to understand more about what lies ahead. He said:
People tend to underestimate how long they’re likely to live, so we’re talking about averages, something very broad-brush. Based on your gender, based on your age, perhaps asking one or two basic questions, like whether you’ve smoked or not, you can tell somebody that they might, on average, live for another 20 years or so.
This suggestion has led to some concerns being expressed at what appears to be an over-simplistic approach. Estimates can only be based on a mix of averages modified by individual information. Would the projections be shared with pension providers? What would you do if you exceeded your forecast life expectancy – by a long way – and had spent all your money? Could you sue someone?
Will your pension pot last as long as you will? The Telegraph, Dan Hyde and Richard Dyson (23/4/2014)
Scientists invent death test that will tell us how long we have to live Metro (11/8/13)
Games host Glasgow has worst life expectancy in the UK The Guardian, Caroline Davies (16/4/2014)
Pensioners could get life expectancy guidance BBC News Politics (17/4/14)
ONS reveals gaps in life expectancy across the UK FT Adviser Pensions, Kevin White (23/4/14)
Health care aid for developing countries boosts life expectancy Health Canal, Ruth Ann Richter (22/4/14)
A third of babies born this year will live to 100 This is Money.co.uk, Adam Uren (11/12/13)
Questions
- Thinking about the UK, what are the factors that might explain variations in life expectancy across different regions? How might the government address these differences? Why would they want to do so?
- Do the same factors explain variations between countries? Who can address these differences? Who would want to do so?
- If you could have a reasonable prediction of your life expectancy at 65, would you want it? How would your behaviour change if you were predicted a longer than average life expectancy? How would it change if you were predicted a shorter than average life expectancy?
- If you could have an accurate prediction of your life expectancy at 18, how would your answers differ? If this were possible, would it present any problems?
 Rising inflation: not normally a cause for celebration, but that’s not the case for Japan. Having been subject to the spectre of deflation for many years, the 22-year high for the CPI at 2.7% is a welcome figure, even it is slightly lower than expected. This surge in prices is partly the result of a growth in domestic demand and a sign, therefore, that output will expand in response to the rise in demand.
The Japanese economy has experienced largely stagnant growth for two decades and a key cause has been falling prices. Although consumers like bargains, this has been problematic for this large economy. Deflation creates continuously falling prices and this means consumers hold back from purchasing durable goods, preferring to wait until prices have fallen further.

In the blog, Japan’s recovery, we looked at inflation data showing Japanese consumer prices growing at a faster rate than expected. This ‘positive’ trend has continued.
When it comes to inflation, expectations are crucial. If people think prices will rise in the future, they are more likely to buy now to get the lower price. This can therefore help to stimulate aggregate demand and it is this that has been the target for Japan. Part of the growth in the CPI is down to the sales tax rise from 5% to 8%. This was the first time in 17 years that the sales tax had increased. Further increases in it are expected in 2015. There were concerns about the impact of this rise, based on the depression that followed the last rise back in 1997, but so far the signs seem good.
Monetary easing was a key component in ending the downward trajectory of the Japanese economy and, following the sales tax rise, many believe that another round of monetary easing may be needed to counter the effects and create further growth in the economy and in the CPI. As the Bank of Japan Governor said:
There are various ways to adjust policy. We will decide what among these measures is appropriate depending on economic and price developments at the time … For now, we can say Japan is making steady progress toward achieving 2 per cent inflation.
One of the ‘three arrows‘ of the government’s policy has been to boost government spending, which should directly increase aggregate demand. Furthermore, with signs of the CPI rising, consumers may be encouraged to spend more, giving a much needed boost to consumption. The economy is certainly not out of the woods, but appears to be on the right path. The following articles consider the Japanese economy.
Japan CPI rises less than expected Wall Street Journal, Takashi Nakamichi (25/4/14)
Japan inflation may beat BOJ forecast Reuters, Leika Kihara (22/4/14)
Tokyo consumer price growth at 22-year high BBC News (25/4/14)
Japan inflation quickens to over 5-year high, output rebounds Reuters, Leika Kihara and Stanley White (31/1/14)
Japan’s consumer inflation set to reach five-year high Guardian (18/4/14)
Tokyo inflation hits 22-year high, inching toward BOJ goal Reuters, Tetsushi Kajimoto and Leika Kihara (25/4/14)
Tokyo’s core CPI got 2.7% lift in April from tax hike The Japan Times (25/4/14)
Is Japan winning the war against deflation? CNBC, Ansuya Harjani (25/4/14)
Questions
- Why is deflation a problem?
- Using an AD/AS diagram, illustrate the problem of expectations and how this contributes to stagnant growth.
- Use the same diagram to explain how expectations of rising prices can help to boost AD.
- Why is the sales tax expected to reduce growth?
- Why is another round of monetary easing expected?
- What government policies would you recommend to a government faced with stagnant growth and falling prices?
 Unemployment and employment are concepts that are often talked about in the media. Indeed, the 7% unemployment target referred to by the Governor of the Bank of England has been a constant feature of recent headlines. However, rather than targeting an unemployment rate of 7%, George Osborne has now called for ‘full employment’ and believes that tax and welfare changes are key to meeting this objective.
Reducing the unemployment rate is a key macroeconomic objective and the costs of unemployment are well-documented. There are obviously big costs to the individual and his/her family, including lower income, dependency, stress and potential health effects. There are also costs to the government: lower income tax revenues, potentially lower revenues from VAT through reduced consumer expenditure and the possibility of higher benefit payments. There are other more ‘economic’ costs, namely an inefficient use of resources. Unemployment represents a cost to the economy, as we are operating below full capacity and we therefore see a waste of resources. It is for this reason that ‘full employment’ is being targeted.
Traditional economic theory suggests that there is a trade-off between unemployment and inflation, illustrated by the well-known Phillips curve. In the past, governments have been willing to sacrifice unemployment for the purpose of reducing inflation. There have also been attempts to boost the economy and create jobs through increased borrowing. However, George Osborne has said:
Unemployment is never a price worth paying, but artificial jobs paid for with borrowed money doesn’t work either.
A figure representing full employment hasn’t been mentioned, so it remains unclear what level of unemployment would be acceptable, as despite the name ‘full employment’, this doesn’t mean that everyone has a job. There are several definitions of full employment, in both an economic and political context. In the period of reconstruction after the Second World War, William Beveridge, architect of the welfare state, defined full employment as where 3% of people would be unemployed.
In more recent times, other definitions have been given. In the era of monetarism in the 1970s, the term ‘natural rate of unemployment’ was used to define the unemployment rate to which economies tend in the long run – after inflationary expectations have adjusted. Keynesians use the term the ‘non-accelerating-inflation rate of unemployment (NAIRU)’, where unemployment is confined to equilibrium unemployment and where there is no excess or deficiency of aggregate demand. Both the natural rate and the NAIRU relate to the rate of unemployment at which the long-run Phillips curve is vertical.

In its Economic and Fiscal Outlook of March 2013, the Office for Budget Responsibility estimated the UK’s NAIRU to be 5.4%. George Osborne has not specified a particular rate. Rather, his speech refers to creating the ‘highest employment rate of any of the world’s leading economies’. He said the ambition was to make the UK:
…the best place in the world to create a job; to get a job; to keep a job; to be helped to look for another job if you lose one…A modern approach to full employment means backing business. It means cutting the tax on jobs and reforming welfare.
Therefore, while it appears that there is no target figure for unemployment, it seems that a new Conservative objective will be to focus on sustainable job creation and eliminate disequilibrium unemployment. This represents a move very much into Labour territory. Meeting the objective will be no easy task, given the past few years and such high levels of youth unemployment, as Labour were quick to point out, but the unemployment figures are certainly moving in the right direction. The following articles consider the objective of full employment.
Articles
Britain’s Osborne changes tone on economy with “full employment” target Reuters, William James (31/3/14)
George Osborne commits to ‘fight for full employment’ BBC News (including video) (1/4/14)
What does full employment mean? The Guardian (1/4/14)
What is full employment? The Telegraph, Peter Dominiczak (31/3/14)
’Jobs matter’, says George Osborne as he aims for full employment Independent, Andrew Grice (31/3/14)
Liam Bynre: Labour would aim for ‘full employment’ BBC News (17/5/13)
Osborne pledges full employment for UK Sky News (31/3/14)
Osborne commits to full employment as election looms Bloomberg, Svenja O’Donnell (31/3/14)
Whatever happened to full employment? BBC News, Tom de Castella and Caroline McClatchey (13/10/11)
Questions
- What is meant by full employment?
- Is it a good idea to target zero unemployment?
- Using a diagram, illustrate the difference between disequilibrium and equilibrium unemployment?
- How can full employment be achieved?
- What are the costs of unemployment?
- Use a diagram to illustrate the natural rate of unemployment and explain what it means in terms of the relationship between unemployment and inflation.
 Globalisation has led to an increasingly interdependent world, with companies based in one country often dependent on a market abroad. In recent years, it is the rapid growth of countries like China that has led to growth in the size of the markets for many products. With incomes rising in emerging countries, demand for many products has been growing, but in the past year, the trend for Prada has ended and seems to be reversing.
As the market in China matures and growth of demand in Europe slows, Prada has seen its shares fall by the largest margin since June last year.
Prada is a well-known luxury brand. The products it sells are relatively expensive and hence its products are likely to have an income elasticity of demand well above +1. With changes in China and Europe, Prada expects its growth in sales to January 2015 will be ‘low single-digit’ – less than the 7% figure recorded for the last financial year.
 This lower growth in same-store sales is likely to continue the following year as well. Add on to this the lower-than-expected profits, which missed analysts’ forecasts, and you have a prime example of a brand that is suffering because of its customer base and the economic times.
Prada isn’t alone in suffering from economic conditions and, relative to its European counterparts, is expected to have higher growth in sales and profits in the next 12 months – at 11.5% and 14.8% respectively. This is according to a survey by Thomson Reuters.
 Prada has exploited high demand by Chinese consumers, but has recently been affected by the strength of the euro. A strong euro means that the Italian-based Prada is struggling with exports, which only adds to its problems. As economic growth picks up in China and as other emerging economies begin to experience more rapid economic growth, the fortunes of this luxury-retailer may change once more. However, with volatile economic times still around in many countries, the future of many retailers selling high-end products to higher income customers will remain uncertain. The following articles consider the fortunes of Prada.
Prada shares fall sharply after China luxury warning BBC News (3/4/14)
Prada falls after forecasting slowing luxury sales growth Bloomberg, Andrew Roberts and Vinicy Chan (3/4/14)
Prada profits squeezed by weakness in Europe and crackdown in China The Guardian (2/4/14)
Prada bets on men to accelerate sales growth Reuters, Isla Binnie (2/4/14)
Prada misses full year profit forecast Independent, Laura Chesters (2/4/14)
Questions
- How can we define a luxury product?
- Explain the main factors which have led to a decline in the demand for Prada products over the past 12 months.
- Using a diagram, illustrate what is meant by a strong euro and how this affects export demand.
- What business strategies are Prada expected to adopt to reverse their fortunes?
- Using a diagram, explain the factors that have caused Prada share prices to decline.
 The latest preliminary GDP estimates for 2014 Q1 suggest that the economy’s output (real GDP) expanded by 0.8 per cent following on the back of a 0.7 per cent increase in 2013 Q4. Growth was observed in three of the four main industrial sectors: 0.9% in services, 0.8% in production and 0.3% in construction. In contrast, output decreased by 0.7% in agriculture. The total output of the economy is now just 0.6 per cent below its 2008 Q1 peak with the output of the service sector now 2.0 per cent higher.