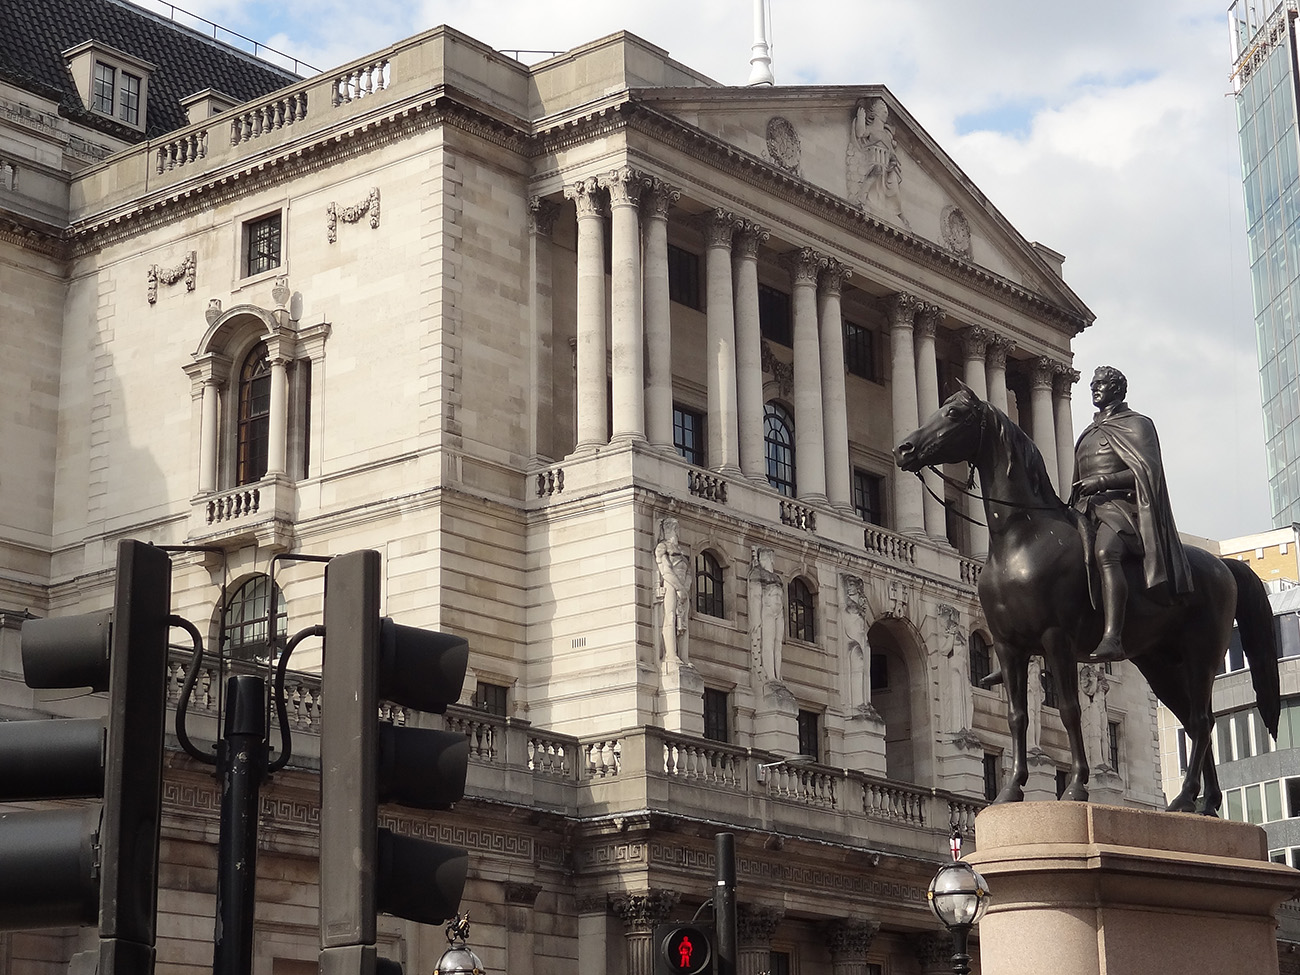
 On 8 February, the Bank of England issued a statement that was seen by many as a warning for earlier and speedier than previously anticipated increases in the UK base rate. Mark Carney, the governor of the Bank of England, referred in his statement to ‘recent forecasts’ which make it more likely that ‘monetary policy would need to be tightened somewhat earlier and by a somewhat greater extent over the forecast period than anticipated at the time of the November report’.
A similar picture emerges on the other side of the Atlantic. With labour markets continuing to deliver spectacularly high rates of employment (the highest in the last 17 years), there are also now signs that wages are on an upward trajectory. According to a recent report from the US Bureau of Labor Statistics, US wage growth has been stronger than expected, with average hourly earnings rising by 2.9 percent – the strongest growth since 2009.
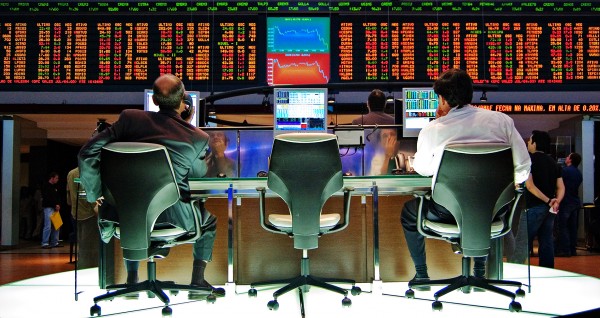 These statements have coincided with a week of sharp corrections and turbulence in the world’s largest capital markets, as investors become increasingly conscious of the threat of rising inflation – and the possibility of tighter monetary policy.
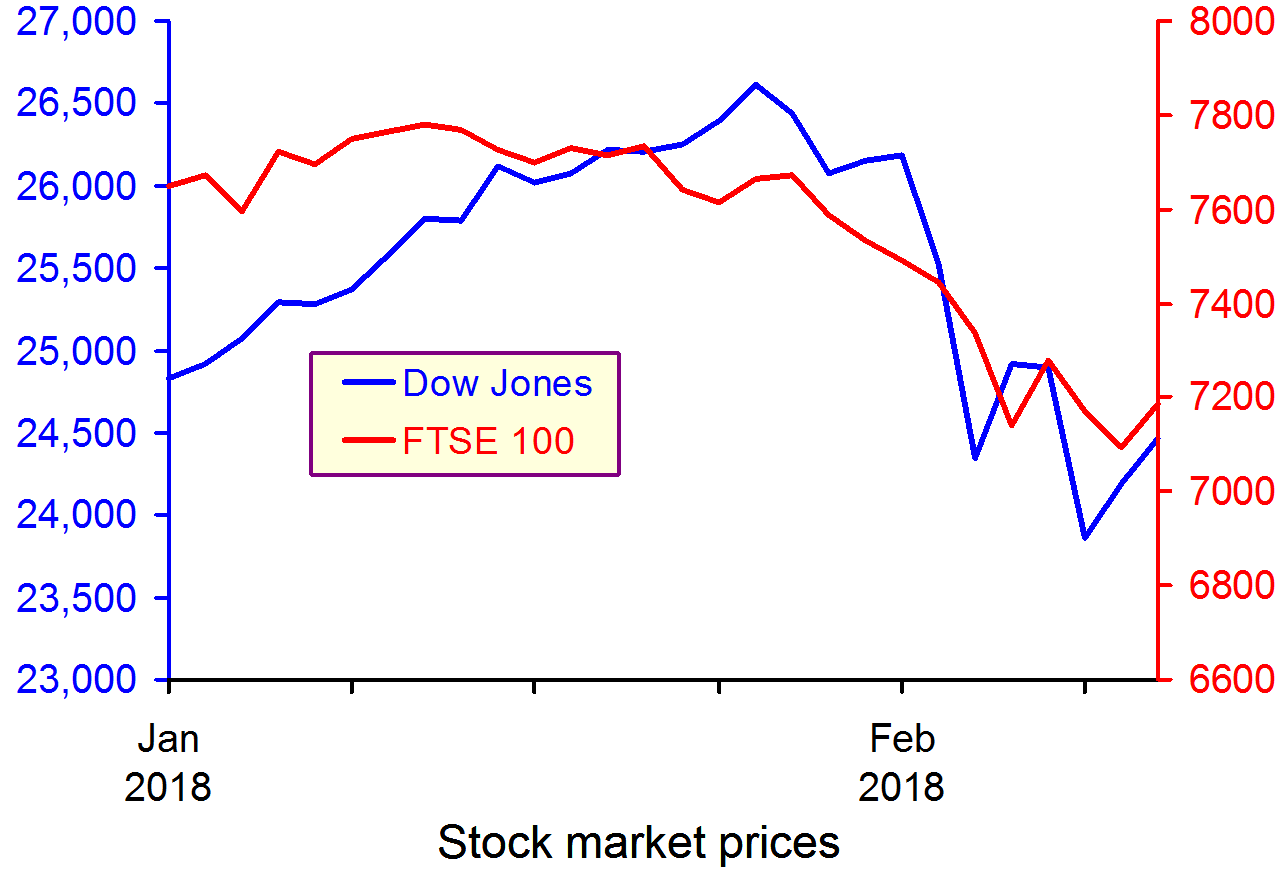
The Dow Jones plunged from an all-time high of 26,186 points on 1 February to 23,860 a week later – losing more than 10 per cent of its value in just five trading sessions (suffering a 4.62 percentag fall on 5 February alone – the worst one-day point fall since 2011). European and Asian markets followed suit, with the FTSE-100, DAX and NIKKEI all suffering heavy losses in excess of 5 per cent over the same period.
 But why should higher inflationary expectations fuel a sell-off in global capital markets? After all, what firm wouldn’t like to sell its commodities at a higher price? Well, that’s not entirely true. Investors know that further increases in inflation are likely to be met by central banks hiking interest rates. This is because central banks are unlikely to be willing or able to allow inflation rates to rise much above their target levels.
The Bank of England, for instance, sets itself an inflation target of 2%. The actual ongoing rate of inflation reported in the latest quarterly Inflation Report is 3% (50 per cent higher than the target rate).
Any increase in interest rates is likely to have a direct impact on both the demand and the supply side of the economy.
Consumers (the demand side) would see their cost of borrowing increase. This could put pressure on households that have accumulated large amounts of debt since the beginning of the recession and could result in lower consumer spending.
Firms (the supply side) are just as likely to suffer higher borrowing costs, but also higher operational costs due to rising wages – both of which could put pressure on profit margins.
It now seems more likely that we are coming towards the end of the post-2008 era – a period that saw the cost of money being driven down to unprecedentedly low rates as the world’s largest economies dealt with the aftermath of the Great Recession.
For some, this is not all bad news – as it takes us a step closer towards a more historically ‘normal’ equilibrium. It remains to be seen how smooth such a transition will be and to what extent the high-leveraged world economy will manage to keep its current pace, despite the increasingly hawkish stance in monetary policy by the world’s biggest central banks.
Video
 Dow plunges 1,175 – worst point decline in history CNN Money, Matt Egan (5/2/18)
Articles
Global Markets Shed $5.2 Trillion During the Dow’s Stock Market Correction Fortune, Lucinda Shen (9/2/18)
Bank of England warns of larger rises in interest rates Financial Times, Chris Giles and Gemma Tetlow (8/2/18)
Stocks are now in a correction — here’s what that means Business Insider, Andy Kiersz (8/2/18)
US economy adds 200,000 jobs in January and wages rise at fastest pace since recession Business Insider, Akin Oyedele (2/2/18)
Questions
- Using supply and demand diagrams, explain the likely effect of an increase in interest rates to equilibrium prices and output. Is it good news for investors and how do you expect them to react to such hikes? What other factors are likely to influence the direction of the effect?
- Do you believe that the current ultra-low interest rates could stay with us for much longer? Explain your reasoning.
- What is likely to happen to the exchange rate of the pound against the US dollar, if the Bank of England increases interest rates first?
- Why do stock markets often ‘overshoot’ in responding to expected changes in interest rates or other economic variables
 In various blogs, we’ve looked at the UK’s low productivity growth, both relative to other countries and relative to the pre-1998 financial crisis (see, for example, The UK productivity puzzle and Productivity should we be optimistic?). Productivity is what drives long-term economic growth as it determines potential GDP. If long-term growth is seen as desirable, then a fall in productivity represents a serious economic problem.
Recent data suggest that the problem, if anything, is worse than previously thought and does not seem to be getting better. Productivity is now some 21% below what it would have been had productivity growth continued at the rate experienced in the years before the financial crisis (see second chart below).
In its latest productivity statistics, the ONS reports that labour productivity (in terms of output per hour worked) fell by 0.1% in the second quarter of 2017. This follows a fall of 0.5% in quarter 1. Over the whole year to 2017 Q2, productivity fell by 0.3%.
 Most other major developed countries have much higher productivity than the UK. In 2016, Italy’s productivity was 9.9% higher than the UK’s; the USA’s was 27.9%, France’s was 28.7% and Germany’s was 34.5% higher. What is more, their productivity has grown faster (see chart).
But what of the future? The Office for Budget responsibility publishes forecasts for productivity growth, but has consistently overestimated it. After predicting several times in the past that UK productivity growth would rise towards its pre-financial crisis trend of around 2% per year, in its October 2017 Forecast evaluation Report it recognises that this was too optimisitic and revises downwards its forecasts for productivity growth for 2017 and beyond.
As the period of historically weak productivity growth lengthens, it seems less plausible to assume that potential and actual productivity growth will recover over the medium term to the extent assumed in our most recent forecasts. Over the past five years, growth in output per hour has averaged 0.2 per cent. This looks set to be a better guide to productivity growth in 2017 than our March forecast of 1.6 per cent.
Looking further ahead, it no longer seems central to assume that productivity growth will recover to the 1.8 per cent we assumed in March 2017 within five years.
 But why has productivity growth not returned to pre-crisis levels? There are five possible explanations.
The first is that there has been labour hoarding. But with companies hiring more workers, this is unlikely still to be true for most employers.
The second is that very low interest rates have allowed some low-productivity companies to survive, which might otherwise have been driven out of business.
The third is a reluctance of banks to lend for investment. After the financial crisis this was driven by the need for them to repair their balance sheets. Today, it may simply be greater risk aversion than before the financial crisis, especially with the uncertainties surrounding Brexit.
The fourth is a fall in firms’ desire to invest. Although investment has recovered somewhat from the years directly following the financial crisis, it is still lower than might be expected in an economy that is no longer is recession. Indeed, there has been a much slower investment recovery than occurred after previous recessions.
The fifth is greater flexibility in the labour market, which has subdued wages and has allowed firms to respond to higher demand by taking on more relatively low-productivity workers rather than having to invest in human capital or technology.
Whatever the explanation, the solution is for more investment in both technology and in physical and human capital, whether by the private or the public sector. The question is how to stimulate such investment.
Articles
UK productivity lagging well behind G7 peers – ONS Financial Times, Katie Martin (6/10/17)
UK productivity sees further fall BBC News (6/10/17)
UK resigned to endless productivity gloom The Telegraph, Tim Wallace (10/10/17)
UK productivity estimates must be ‘significantly’ lowered, admits OBR The Guardian, Richard Partington and Phillip Inman (10/10/17)
UK productivity growth to remain sluggish, says OBR BBC News (10/10/17)
Official Treasury forecaster slashes UK productivity growth forecast, signalling hole in public finances for November Budget Independent, Ben Chu (10/10/17)
The Guardian view on Britain’s productive forces: they are not working The Guardian, Editorial (10/10/17)
Mind the productivity gap: the story behind sluggish earnings The Telegraph, Anna Isaac (26/10/17)
Data and statistical analysis
Labour productivity: April to June 2017 ONS Statistical Bulletin (6/10/17)
International comparisons of productivity ONS Dataset (6/10/17)
Forecast evaluation report OBR (October 2017)
Questions
- Explain the relationship between labour productivity and potential GDP.
- What is the relationship between actual growth in GDP and labour productivity?
- Why does the UK lag France and Germany more in output per hour than in output per worker, but the USA more in output per worker than in output per hour?
- Is there anything about the UK system of financing investment that results in lower investment than in other developed countries?
- Why are firms reluctant to invest?
- In what ways could public investment increase productivity?
- What measures would you recommend to encourage greater investment and why?
- How do expectations affect the growth in labour productivity?
 With the Conservatives having lost their majority in Parliament in the recent UK election, there is renewed discussion of the form that Brexit might take. EU states are members of the single market and the customs union. A ‘hard Brexit’ involves leaving both and this was the government’s stance prior to the election. But there is now talk of a softer Brexit, which might mean retaining membership of the single market and/or customs union.
The single market
Belonging to the single market means accepting the free movement of goods, services, capital and labour. It also involves tariff-free trade within the single market and adopting a common set of rules and regulations over trade, product standards, safety, packaging, etc., with disputes settled by the European Court of Justice. Membership of the single market involves paying budgetary contributions. Norway and Iceland are members of the single market.
The single market brings huge benefits from free trade with no administrative barriers from customs checks and paperwork. But it would probably prove impossible to negotiate remaining in the single market with an opt out on free movement of labour. Controlling immigration from EU countries was a key part of the Leave campaign.
The customs union
This involves all EU countries adopting the same tariffs (customs duties) on imports from outside the EU. These tariffs are negotiated by the European Commission with non-EU countries  on a country-by-country basis. Goods imported from outside the EU are charged tariffs in the country of import and can then be sold freely around the EU with no further tariffs.
Remaining a member of the customs union would allow the UK to continue trading freely in the EU, subject to meeting various non-tariff regulations. It would also allow free ‘borderless’ trade between Northern Ireland and the Republic of Ireland. However, being a member of the customs union would prevent the UK from negotiating separate trade deals with non-EU countries. The ability to negotiate such deals has been argued to be one of the main benefits of leaving the EU.
Free(r) trade area
The UK could negotiate a trade deal with the EU. But it is highly unlikely that such a deal could be in place by March 2019, the date when the UK is scheduled to leave the EU. At that point, trade barriers would be imposed, including between the two parts of the island of Ireland. Such deals are very complex, especially in the area of services, which are the largest category of UK exports. Negotiating tariff-free or reduced-tariff trade is only a small part of the problem; the biggest part involves negotiating product standards, regulations and other non-tariff barriers.
All the above options thus involve serious problems and the government will be pushed from various sides, not least within the Conservative Party, for different degrees of ‘softness’ or ‘hardness’ of Brexit. What is more, the pressure from business for free trade with the EU is likely to grow. Brexit may mean Brexit, but just what form it will take is very unclear.
Articles
Free trade area, single market, customs union – what’s the difference? BBC News, Jonty Bloom (12/6/17)
Brexit: What are the options? BBC News (12/6/17)
After the election, the real test: Brexi The Economist (8/6/17)
May’s Ministers Plot Softer Brexit to Keep UK in Single Market Bloomberg, Tim Ross, Alex Morales and Svenja O’Donnell (11/6/17)
UK’s Hung Parliament Raises Business Hopes for a Softer Brexit Bloomberg, Stephanie Baker and James Paton (12/6/17)
Do not exaggerate the effect the election will have on Brexit Financial Times, Wolfgang Münchau (11/6/17)
What is soft Brexit? How could it work as UK negotiates leaving the EU? Independent, May Bulman (12/6/17)
Brexit-lite back on the table as Britain rethinks its options after election The Guardian, Dan Roberts (11/6/17)
Review plan to quit EU Customs Union, urges FTA FoodManufacture.co.uk, James Ridler (12/6/17)
Freight leaders urge government to review decision to leave EU customs union RTM (12/6/17)
Paper
Making Brexit work for British Business: Key Execution Priorities M-RCBG Associate Working Paper No. 77, Harvard Kennedy School, Peter Sands, Ed Balls, Sebastian Leape and Nyasha Weinberg (June 2017)
Questions
- Explain the trading agreement between Norway and the EU.
- How does the Norwegian arrangement with the EU differ from the Turkish one?
- What are meant by the terms ‘hard Brexit’ and ‘soft Brexit’?
- How does a customs union differ from a free trade area?
- Is it possible to have (a) a customs union without a single market; (b) a single market without a customs union?
- To what extent is it in the EU’s interests to negotiate a deal with the UK which lets it maintain access to the customs union without having free movement of labour?
- The EU insists that talks about future trading arrangements between the UK and the EU can take place only after sufficient progress has been made on the terms of the ‘divorce’. What elements are included in the divorce terms?
- If agreement is not reached by 29 March 2019, what happens and what would be the consequences?
- Will a hung parliament, or at least a government supported by the DUP on a confidence and supply basis, make it more or less likely that there will be a hard Brexit?
- For what reasons may the EU favour (a) a hard Brexit; (b) a soft Brexit?
 In the light of the Brexit vote and the government’s position that the UK will leave the single market and customs union, there has been much discussion of the need for the UK to achieve trade deals. Indeed, a UK-US trade deal was one of the key issues on Theresa May’s agenda when she met Donald Trump just a week after his inauguration.
But what forms can a trade deal take? What does achieving one entail? What are likely to be the various effects on different industries – who will be the winners and losers? And what role does comparative advantage play? The articles below examine these questions.
Given that up until Brexit, the UK already has free trade with the rest of the EU, there is a lot to lose if barriers are erected when the UK leaves. In the meantime, it is vital to start negotiating new trade deals, a process that can be extremely difficult and time-consuming.
A far as new trade arrangements with the EU are concerned, these cannot be agreed until after the UK leaves the EU, in approximately two years’ time, although the government is keen that preliminary discussions take place as soon as Article 50 is triggered, which the government plans to do by the end of March.
Articles
Trade deals are difficult to negotiate and Britain lacks the skills for the job The Conversation, Nigel Driffield (27/1/17)
Why a U.S.-U.K. Trade Deal Could be Harder than it Sounds Newsweek, Josh Lowe (26/1/17)
UK-US trade deal will have ‘very small upsides’ for Britain, says former Bank of England economist Independent, Rob Merrick (26/1/17)
Trump says he wants a U.K. trade deal. Don’t hold your breath CNN Money, Alanna Petroff (23/1/16)
Reality Check: Can there be a quick UK-USA trade deal? BBC News, Jonty Bloom (16/1/17)
Questions
- What elements would be included in a UK-US trade deal?
- Explain the gains from trade that can result from exploiting comparative advantage.
- Explain the statement in the article that allowing trade to be determined by comparative advantage is ‘often politically unacceptable, as governments generally look to protect jobs and tax revenues, as well as to protect activities that fund innovation’.
- Why is it difficult to work out in advance the likely effects on trade of a trade deal?
- What would be the benefits and costs to the UK of allowing all countries’ imports into the UK tariff free?
- What are meant by ‘trade creation’ and ‘trade diversion’? What determines the extent to which a trade deal will result in trade creation or trade diversion?
 Theresa May has said that the UK will quit the EU single market and seek to negotiate new trade deals, both with the EU and with other countries. As she said, “What I am proposing cannot mean membership of the single market.” It would also mean leaving the customs union, which sets common external tariffs for goods imported into the EU.
The single market guarantees free movement of goods, services, labour and capital between EU members. There are no internal tariffs and common rules and regulations concerning products, production and trade. By leaving the single market, the UK will be able to restrict immigration from EU countries, as it is currently allowed to do from non-EU countries.
A customs union is a free trade area with common external tariffs and uniform methods of handling imports. There are also no, or only minimal, checks and other bureaucracies at borders between members. The EU customs union means that individual EU countries are not permitted to do separate trade deals with non-EU countries.
 Once the UK has left the EU, probably in around two years’ time, it will then be able to have different trade arrangements from the EU with countries outside the EU. Leaving the customs union would mean that the UK would face the EU’s common external tariff or around 5% on most goods, and 10% on cars.
Leaving the EU single market and customs union has been dubbed ‘hard Brexit’. Most businesses and many politicians had hoped that elements of the single market could be retained, such as tariff-free trade between the UK and the EU and free movement of capital. However, by leaving the single market, access to it will depend on the outcome of negotiations.
Negotiations will take place once Article 50 – the formal notice of leaving – has been invoked. The government has said that it will do this by the end of March this year. Then, under EU legislation, there will be up to two years of negotiations, at which point the UK will leave the EU.
The articles look at the nature of the EU single market and customs union and at the implications for the UK of leaving them.
Articles
Britain to leave EU market as May sets ‘hard Brexit’ course Reuters, Kylie MacLellan and William James (17/1/17)
Brexit: UK to leave single market, says Theresa May BBC News (17/1/17)
How Does U.K. Want to Trade With EU Post-Brexit?: QuickTake Q&A Bloomberg, Simon Kennedy (17/1/17)
Brexit at-a-glance: What we learned from Theresa May BBC News, Tom Moseley (17/1/17)
Theresa May unveils plan to quit EU single market under Brexit Financial Times, Henry Mance (17/1/17)
Doing Brexit the hard way The Economist (21/1/17)
Theresa May confirms it’ll be a hard Brexit – here’s what that means for trade The Conversation, Billy Melo Araujo (17/1/17)
How to read Theresa May’s Brexit speech The Conversation, Paul James Cardwell (17/1/17)
Theresa May’s hard Brexit hinges on a dated vision of global trade The Conversation, Martin Smith (17/1/17)
Brexit: What is the EU customs union and why should people care that the UK is leaving it? Independent, Ben Chapman (17/1/17)
Questions
- Explain the difference between a free-trade area, a customs union, a common market and a single market.
- What arrangement does Norway have with the EU?
- How would the UK’s future relationship with the EU differ from Norway’s?
- Distinguish between trade creation and trade diversion from joining a customs union. Who loses from trade diversion?
- Will leaving the EU mean that trade which was diverted can be reversed?
- What will determine the net benefits from new trade arrangements compared with the current situation of membership of the EU?
- What are the possible implications of hard Brexit for (a) inward investment and (b) companies currently in the UK of relocating to other parts of the EU? Why is the magnitude of such effects extremely hard to predict?
- Explain what is meant by ‘passporting rights’ for financial services firms. Why are they unlikely still to have such rights after Brexit?
- Discuss the argument put forward in The Conversation article that ‘Theresa May’s hard Brexit hinges on a dated vision of global trade’.
 On 8 February, the Bank of England issued a statement that was seen by many as a warning for earlier and speedier than previously anticipated increases in the UK base rate. Mark Carney, the governor of the Bank of England, referred in his statement to ‘recent forecasts’ which make it more likely that ‘monetary policy would need to be tightened somewhat earlier and by a somewhat greater extent over the forecast period than anticipated at the time of the November report’.
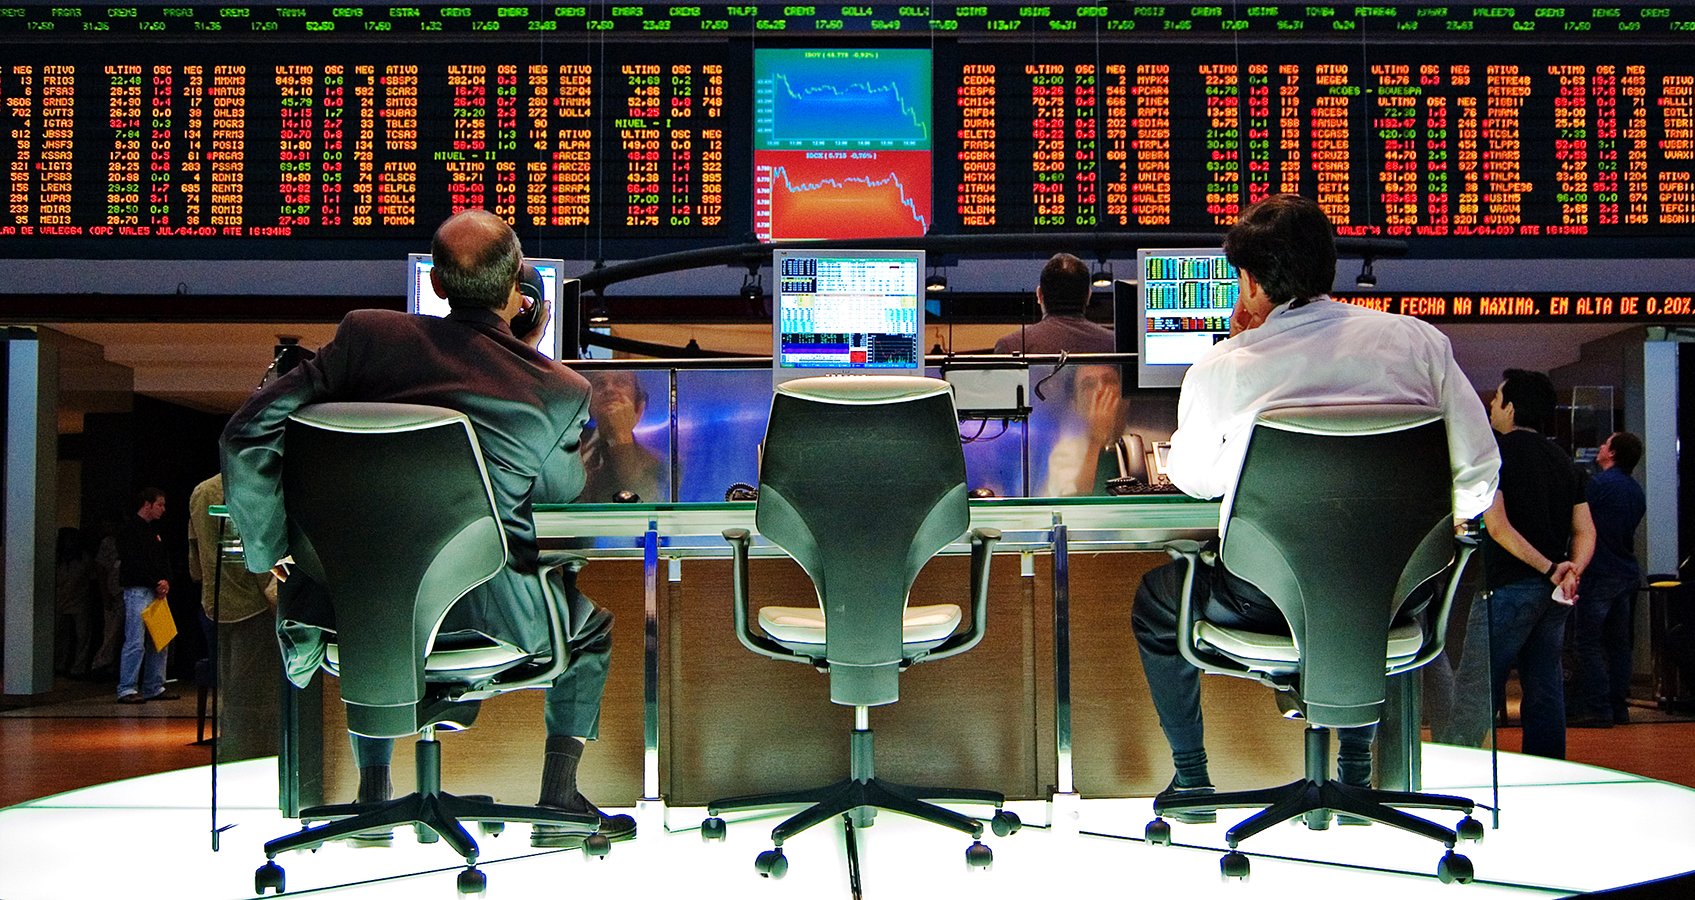 These statements have coincided with a week of sharp corrections and turbulence in the world’s largest capital markets, as investors become increasingly conscious of the threat of rising inflation – and the possibility of tighter monetary policy.


