 The Office for National Statistics (ONS) reported that the quantity of retail sales in the UK was 3.9% higher in August than it had been in July. However strong price competition meant that the value of these sales increased by only 0.4%. What were the key factors driving the big increase in the quantity of sales? Was it simply the response of consumers to falling prices?
The data indicated that there was strong demand for goods associated with the housing market such as carpets, fridges and cookers. Spending on furniture increased very rapidly with sales rising by 24% over a 12 month period. Flat packed furniture proved to be particularly popular with consumers.
There was also strong demand for electrical goods and more specifically vacuum cleaners. The ONS estimated that a boom in the sale of vacuum cleaners in August was responsible for 25% of the increase in retail sales.
Why did the sales of vacuum cleaners increase so rapidly in August? Did UK households suddenly decide to keep their houses cleaner? The sales data shows that certain types of vacuum cleaners sold in much larger numbers than others.
For example, Tesco reported a 44% increase in the sales of 2,000 watt vacuum cleaners in the last two weeks in August while the Co-op reported an increase of 38%. Referring to the last weekend in August, the head of small domestic appliances at the on-line retailer ao.com stated that
We saw a huge surge in sales of corded vacuums over 1,600 watts over the weekend, with sales quadrupling.
There were also reports that a significant number of customers were buying more than one vacuum cleaner with these larger motors.
The key reason for the sudden surge in demand was the implementation of new regulations by the European Union as part of its energy efficiency directive. The ultimate objective of this directive is to reduce climate change. The specific policy that appears to have had such a big impact on consumers in the UK was the ban imposed on firms in the EU from making or importing vacuum cleaners that have motors above 1600 watts. This ban came into effect on the 1st September 2014.
A spokesperson for the consumer group Which? stated in August that
If you’re in the market for a powerful vacuum, you should act quickly, before all the models currently sell out. A Best Buy 2,200-watt vacuum costs around £27 a year to run in electricity – only around £8 more than the best scoring 1,600-watt we’ve tested.
The EU plans to reduce the maximum permitted wattage in vacuum cleaners to 900 watts in 2017. Restrictions have already been imposed on bigger electrical appliances such as televisions, washing machines and refrigerators. The EUs Ecodesign directive may also be extended to a range of smaller electrical appliances such as toasters and hair dressers in the future. It’ll be interesting to see if consumers respond in the same way to regulations imposed by the EU in the future.
Ten days left to vacuum up a powerful cleaner BBC (21/08/14)
Housing boom, food discounting and vacuum ban boost UK spending The Guardian, Larry Elliott, Phillip Inman, Lisa Bachelor (18/9/14)
UK retail sales boosted by vacuum cleaner sales BBC (18/9/14)
Retailers sell out of vacuum cleaners ahead of EU ban The Telegraph, Elliot Pinkham (30/8/14)
Power surge! Fourfold rise in sales of super vacuums: Some customers buying two or more models to beat new EU regulations Daily Mail, Andrew Levy (1/9/14)
Energy Efficiency Directive European Commission (accessed on 24/9/14)
Vacuum cleaner splurge pushes up UK retail sales The Guardian, Phillip Inman (18/9/14)
Questions
- Using a demand and supply diagram, illustrate what has happened in the market for high wattage vacuum cleaners in August. Pay particular attention in your answer to the role of expectations.
- What did your previous diagram predict would happen to the price of high wattage vacuum cleaners in August? Did this in fact happen?
- A fully informed rational consumer may purchase a higher wattage vacuum cleaner if they consider that the improvement in cleaning performance is greater than the extra cost of purchasing and using the cleaner. Can you provide an economic rationale for banning the sale of these machines in these circumstances?
- Using a demand and supply diagram illustrate the impact of banning the sale of a product in a competitive market.
 Officials from Rugby Union’s Aviva Premiership recently announced that the salary cap used by the league would increase from £4.76 million to £5.1 million per team for the 2015-16 season. It is not the only professional sports league to use this type of regulation. The NFL currently has a salary cap of $133 million/team while in the NBA it is set at $63 million/team. What is the rationale for placing restrictions on the amount an organisation can pay its employees? How do these caps work in practice?
A salary cap is a regulation that limits the amount that an organisation can pay its employees. Sanctions are usually imposed if the ceiling is broken.
It is hard to imagine this type of policy being introduced in most industries. For example there may have been a number of calls for much greater regulation of the big six firms in the energy market with the Labour party suggesting that prices should be frozen for 20 months. However in amongst all the calls for more intervention, nobody has suggested that limits should be placed on the wages that these firms pay their staff.
One example where the authorities are thinking of intervening on pay is the proposal by the European Union to introduce a cap on the size of bonuses that can be paid by firms in the banking industry. However this is more of a constraint on the method of remuneration rather than an absolute limit on the level of pay. If the policy was introduced there would be nothing preventing firms from increasing basic salaries in order to make up for any shortfall caused by the reduction in bonuses.
There is one sector of the economy where salary caps are widely used – professional team sports. There are a number of different ways they have been implemented. For example the Football Association once placed a limit on the amount that a club could pay an individual player. This was originally set at £4/week in 1901 and increased to £20/week before it was finally abolished in 1961.
In recent times it has been far more common for salary caps in professional sports leagues to place limits on the size of a team’s total wage bill rather than the amount that can be paid to an individual player. This is the case in the Aviva Premiership, the NFL and the NBA. Perhaps it would be more accurate to refer to these policies as a cap on payrolls rather than on salaries.
The Aviva Premiership gives the following 4 reasons for having the payroll cap that it first introduced in 1999:
|
|
| • |
To ensure the financial viability of the clubs; |
| • |
To ensure a competitive Aviva Premiership Rugby competition; |
| • |
To control inflationary pressures on clubs’ costs; |
| • |
To provide a level playing field for the clubs. |
It is claimed that the policy has helped the league to achieve these objectives as (a) more clubs are now breaking even and (b) compared with other rugby competitions it has the greatest number of games that finish with less than one score between the teams.
There are a number of different ways that a payroll cap can be implemented. With an absolute payroll scheme all the teams in the league, no matter what their size, face the same constraint. This is the policy adopted by the NFL, NBA and the Aviva Premiership. An alternative is to implement a percentage payroll cap. Examples of these can be found in League 1 and League 2 of the English Football League. League 1 teams can spend up to 60% of their turnover on wages while League 2 teams can spend up to 55% of their turnover on wages. Obviously this means that well supported clubs with a larger turnover can spend more on players’ wages than less well supported clubs with a smaller turnover.
Another way that payroll caps differ is whether they are ‘hard’ caps or ‘soft’ caps. With a ‘hard’ cap there are no exceptions to the scheme. All the teams’ payrolls must remain within the same limit set by the league officials. With a ‘soft’ cap the authorities identify some exceptions that enable clubs to exceed the limit. The payroll cap used in rugby union is an example of a soft cap and works in the following way.
There are a number of elements to the scheme:
|
|
| • |
The senior salary cap; |
| • |
Excluded players; |
| • |
The academy credits. |
 The senior salary cap is the major part of the regulation and the Aviva Premiership announced that this would increase from £4.76 million per team in the current season to £5.1 million per team for 2015-16. The Academy credits enable teams to exceed this £5.1 million limit if they train and develop younger players. The teams have to prove that they have young players that meet the following criteria:
|
|
| • |
They are under the age of 24 before the season started; |
| • |
They joined the youth academy before their eighteenth birthday; |
| • |
They earn more than £30,000 per year. |
For a player who meets these conditions it is only their salary in excess of £30,000/year that is considered. For example if a young player was paid £50,000/year then only £20,000 of his wages would count towards the team’s payroll cap. The first £30,000 would not count. The Aviva Premiership recently announced that a home grown player credit would replace the academy credits. Under the new scheme the upper age limit will be removed and clubs can claim up to £400,000 in allowances. This means that teams could spend up to £5.5 million a year on wages if they train and develop younger players.
However other exceptions means that teams can exceed even this figure. The payroll cap arrangements allow teams to identify one player whose wages are not included when the payroll cap is calculated. In order to be nominated the exempted player has to meet certain criteria. In the 2015-16 season teams will be allowed to have two excluded players.
Sir Iain McGeechan has suggested that these changes will increase the effective salary cap to £7 million/year with some star players earning £1 million/season. However this would still be below the level of the basic salary cap in the French Rugby Union Super 14 League which is €10 million per season (approximately £8.5 million)
Premiership salary cap will leave small clubs playing catch-up The Telegraph (20/9/14)
Bath line up move for Australian Will Genia as new salary cap regulations come into effectThe Telegraph (15/9/14)
The salary cap in Rugby Union Law in Sport (15/4/14)
Barwell blasts salary cap ‘cheats’ ESPN (1/3/13)
Salary Cap changes confirmed Premiership Rugby (17/9/14)
What is meant by a salary cap in Sport and would this ever be used in English football? In Brief (accessed on 22/9/14)
Questions
- Draw a diagram to illustrate the impact of a salary cap on a perfectly competitive market and explain your answer.
- Which teams in the Aviva Premiership would be in favour of the increase in the salary cap and which teams would be opposed? Explain your answer.
- Do you think that an absolute or percentage salary cap would be more effective at maintaining competitive balance in a league? Which teams would be more in favour of an absolute salary cap?
- Why do think some leagues have introduced a ‘soft’ rather than a ‘hard’ salary caps?
- To what extent do you think that salary/payroll caps are consistent with European single market principles about the free movement of people?
- Officials from the Aviva Premiership provide the clubs with a long list of payments which must be counted as part of a player’s salary. These include holiday costs, school fees, payment for off-field activities on behalf of the club, payments in kind and signing on fees. Why do you think that the authorities provide such a large list?
- Find out the criteria that must be met in order for a player to be exempted from the team’s payroll calculations. Provide some reasons why you think these criteria were used.
 Every year thousands of entrepreneurs will have another great idea that is sure to take off and bring in millions of customers. However, most of these great ideas will turn into another business failure. But, in the case of Dropbox, it is multiple business failures that eventually created a huge success, giving hope to millions of budding entrepreneurs.
With 300 million users, the file sharing ‘Dropbox’ is certainly a success, estimated at a value of $10bn. But it didn’t happen immediately and was preceded by a few failures. So, what is the secret to success in this case? The co-founder of Dropbox, Drew Houston, said that it is all about providing something that customers want. In the case of Dropbox, customers are crucial: the more people use it, the easier it becomes for others to use it too, as it allows file sharing on a much larger scale. Perhaps here we have a case of network externalities.
With Dropbox people would tell their friends about it and collaborate. So when you go into work and work on a project with colleagues you recruit them in essence to become Dropbox users because you’re all working on a project together.
No doubt there are many other examples of businesses that have proved a success after several failed attempts. Providing customers with what they want, at the time when they need it is clearly a key ingredient, but so, it appears, is business failure. The following article from BBC News considers the rise of Dropbox.
 Dropbox and the failures behind it BBC News, Richard Taylor (1/7/14)
Questions
- Customers are clearly crucial for any business to succeed. How can a new entrepreneur find out if there is a demand?
- Why was timing so important in the case of Dropbox?
- Given that customers can actually use Dropbox for free, how does this company make so much money?
- What are network externalities? Explain them in the context of Dropbox.
- Drew Houston says that ‘distribution’ is another key ingredient to success. What do you think is meant by this and how will it help create success?
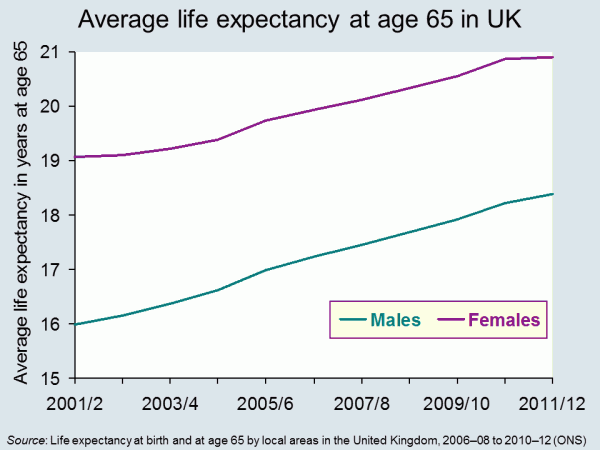 Life expectancy is increasing across the world and the latest set of figures from the Office for National Statistics show that in the UK it has passed 79 for boys born in 2010–12, and 82 for girls born then. In fact the prediction is that over a third of babies born in 2013 will live to more than 100. The data throws up some interesting questions. How well prepared are we for lives that last this long? And how evenly distributed is this increase in life expectancy? Pensions’ minister, Steve Webb, has called for better information on life expectancy to be shared. How would this impact on our decision making?
It seems reasonable to think that increasing life expectancy must be good news. And of course, for individuals it can be. In 1951 the average man retiring at 65, in England and Wales, could expect to live and draw a pension for another 12.1 years. By 2014 this had risen to 22 years.
 But while we can look forward to longer life, for the government, it presents some challenges The first is that we just don’t save enough for our old age. This seems to be partly because we find it hard to make decisions that will have an impact so far in the future. There are a number of measures that have been put in place to encourage us to save more, including auto-enrolment into company pension schemes. This is being rolled out across businesses over the next three years. In the 2014 Budget, the Chancellor announced that people reaching retirement age will be able to draw all their pension as a cash lump sum, rather than having to take it as a regular income.
Another concern for government is the variations that we find in life expectancy across the UK. The 2014 ONS data identified that life expectancy for men born in Glasgow in 2012 is 72.6, in East Dorset it is 82.9. 25% of those in Glasgow are not expected to live to 65. The gap in years of good health is even greater. This presents governments with a long-term problem. How do they achieve greater equality in this instance? Do they focus resources on the areas that need it most? Do they legislate to address behaviour? Or do they rely on the provision of good advice – on diet, exercise and other factors?
Information has a role to play in both areas identified above. In April 2014, Steve Webb, suggested that in order to make good decisions at the point of retirement, people need to understand more about what lies ahead. He said:
People tend to underestimate how long they’re likely to live, so we’re talking about averages, something very broad-brush. Based on your gender, based on your age, perhaps asking one or two basic questions, like whether you’ve smoked or not, you can tell somebody that they might, on average, live for another 20 years or so.
This suggestion has led to some concerns being expressed at what appears to be an over-simplistic approach. Estimates can only be based on a mix of averages modified by individual information. Would the projections be shared with pension providers? What would you do if you exceeded your forecast life expectancy – by a long way – and had spent all your money? Could you sue someone?
Will your pension pot last as long as you will? The Telegraph, Dan Hyde and Richard Dyson (23/4/2014)
Scientists invent death test that will tell us how long we have to live Metro (11/8/13)
Games host Glasgow has worst life expectancy in the UK The Guardian, Caroline Davies (16/4/2014)
Pensioners could get life expectancy guidance BBC News Politics (17/4/14)
ONS reveals gaps in life expectancy across the UK FT Adviser Pensions, Kevin White (23/4/14)
Health care aid for developing countries boosts life expectancy Health Canal, Ruth Ann Richter (22/4/14)
A third of babies born this year will live to 100 This is Money.co.uk, Adam Uren (11/12/13)
Questions
- Thinking about the UK, what are the factors that might explain variations in life expectancy across different regions? How might the government address these differences? Why would they want to do so?
- Do the same factors explain variations between countries? Who can address these differences? Who would want to do so?
- If you could have a reasonable prediction of your life expectancy at 65, would you want it? How would your behaviour change if you were predicted a longer than average life expectancy? How would it change if you were predicted a shorter than average life expectancy?
- If you could have an accurate prediction of your life expectancy at 18, how would your answers differ? If this were possible, would it present any problems?
 A previous article on this website (Why buy a football club?) focused on the issue of why people buy football clubs. This blog refers to the somewhat strange situation where people who have made large amounts of money from a very successful business career always seem to lose money when they invest in a football team.
The Deloitte’s report into football finance found that in the 2012/13 season only half the clubs in the English Premier League (EPL) made an operating profit – profits excluding net transfer expenditure. When the impact of transfer expenditure is included, even fewer clubs make any money. For example, the three teams battling it out for the EPL title this year, Chelsea, Liverpool and Manchester City, reported losses for 2012/13 of £49.4 million, £49.8 million and £51.6m respectively.
What makes the size of these losses even more astonishing is that they have occurred in a period when the revenues earned by the top clubs have increased rapidly. In 2004/05 the combined revenue of the 20 EPL clubs was £1.3billion. By 2011/12 this figure had increased to £2.36 billion.
Given these rapidly rising revenue streams, the main explanation for this poor profit performance is the growth in players’ salaries. It has been estimated that approximately 80% of the increase in revenues generated by the team in the EPL since it began in 1992 have gone to the players in higher wages. In 2011/12 the total wage bill in the EPL was a staggering £1.658 billion, with an average wage bill of £83 million per club. The average weekly wage of a player has doubled over the past six years and is now estimated to be between £25,000 and £30,000 per week.
One deal which recently hit the headlines was that of Wayne Rooney who signed a five-year contract with earnings of up to £300,000 a week or £15.6m annually. However, Mr Rooney is still a long way short of the highest paid sports star. When based on wages and win bonuses, Forbes reported this to be American footballer, Aaron Rodgers, who was paid £25.75m in 2012-13!!!
One major factor that can partly explain this rapid increase in players’ pay is the increased competition for their skills. The potential impact of the transfer system on players’ mobility and wages was discussed in an article on the website in December (Recent challenges to the football transfer system). The career of Tom Finney provides an interesting case study of the impact of the monopsony power that the transfer system and maximum wage used to give the clubs.
Finney was one of the most talented footballers of the 1940s/50s but he played at a time when there was still a maximum wage and a transfer system that was far more restrictive that it is today. He first played in the youth team for Preston North End in 1936 aged 14. Apart for a three-year period between 1942 and 1945 when he served in the army during the Second World War, he remained with Preston for his whole career. He finally retired in 1959 at the age of 38 having scored 210 goals in 473 appearances. He also played in three World Cup final tournaments and scored 30 goals in his 76 international appearances for England.
When he died in February of this year many people talked of his loyalty to Preston and the fact that he only earned £20/week when he retired (the maximum wage at the time) and had to supplement his income by working as a plumber. However, interestingly in 1952 an Italian club – Palermo – tried to sign Finney from Preston on a deal which would have paid him a basic weekly wage of £32.25, a bonus of up to £100 per week and a signing on fee of £10,000. At the time he earned the maximum wage of £14 per week with Preston and received a win bonus of up to £2 per week. Palermo also offered him a luxury Mediterranean villa, a brand new sports car and unlimited travel between England and Italy funded by the club. Unsurprisingly, Finney was tempted by the deal and commented that:
There was a genuine appeal about the prospect of trying my luck abroad, not to mention the money and the standard of living.
However, because of the transfer system in place at the time, Preston could block the move. The chairman explained to Finney:
Tom, I’m sorry, but the whole thing is out of the question, absolutely out of the question. We are not interested in selling you and that’s that. Listen to me, if tha’ doesn’t play for Preston then tha’ doesn’t play for anybody.
The club also announced that they would not consider selling Finney for any transfer fee below £50,000. Palermo had offered £30,000 and the transfer record at the time was less that £20,000.
It is highly unlikely that football will ever return to a type of transfer system and maximum wage that gives the clubs the sort of monopsony power they had in Finney’s days. However a new set of policies have been recently agreed and introduced to try to slow down the increase in players’ pay. Financial Fair Play rules set limits on the size of financial losses that clubs can incur over a three-year period. If these rules are broken, then UEFA could prevent the guilty team from entering lucrative competitions such as the Champions League. The EPL also has the power to award points deductions.
With the combined revenues of the 20 EPL clubs forecast to increase by 24% to £3.080 billion in the 2013/14 season, it will be interesting to see how much of this money improves the financial performance of the clubs and how much goes into players’ wages.
Articles
Questions
- Draw a diagram to illustrate the impact of a maximum wage on a perfectly competitive labour market and explain your answer.
- Analyse the impact of the maximum wage on worker surplus, firm surplus and deadweight welfare loss. Draw a diagram to illustrate your answer. Comment on the impact of the maximum price on economic efficiency.
- Draw a diagram to illustrate the impact of a maximum wage on a monopsonistic labour market. Assess its impact on economic efficiency.
- Some authors have argued that the Financial Fair Play regulations are a form of vertical restraint/agreement. What is a vertical restraint?
- Find an example of a vertical restraint in a different industry. What impact will it have on economic welfare?