 Global merger and acquisition deals with a combined value of £2.7 trillion ($4.06 trillion) have taken place so far this year (1 Jan to 3 Nov). This is a 38% increase on the same period in 2014 ($2.94 trillion) and even surpasses the previous record high for the same period in 2007 ($3.93 trillion) (see the chart from the Dealogic article linked below).
Measured by dollar value, October was the fifth biggest month in Mergers and Acquisitions (M&As) history with the announcement of $514bn of actual or proposed deals. These included:
|
|
| • |
the proposed £71 billion deal to acquire SABMiller (the world’s second largest brewer) by AB InBev (the world’s largest brewer); |
| • |
the $67bn takeover of network storage provider EMC by Dell (the world’s third largest computer supplier); |
| • |
the proposed deal to acquire Allergan (producer of Botox) by Pfizer (the producer of Viagra). |
Although the dollar value of M&As was extremely large in October the actual number of deals, 2177, was significantly lower than the average of 3521 over the previous 9 months.
Are these large M&As in the interests of the consumer? One advantage is that the newly combined firms may have lower average costs. Reports in the press, following the announcement of most M&As, often discuss the potential for reductions in duplicate resources and rationalisation. After the successful completion of a takeover two previously separate departments, such as finance, law or HRM, may be combined into one office. If the newly integrated department is (i) smaller than the previous two departments added together and (ii) can operate just as effectively, then average costs will fall. This is simply an example of an economy of scale.
Average costs will also decrease if x-inefficiency within the acquired business can be reduced or eliminated. X-inefficiency exists when an organisation incurs higher costs than are necessary to produce any given output. In other words it is not producing in the cheapest possible way. In a number of takeovers in the brewing industry, AB InBev has gained a fearsome reputation for minimising costs and removing any waste or slack in acquired organisations. In an interview with the Financial Times, its chief executive, Carlos Brito, stated that:
“In any company, there’s 20 per cent that lead, 70 per cent that follow and 10 per cent that do nothing. So the 10 per cent, of course, you need to get rid of.”
If any reduction in costs results in lower prices without any lessening in the quality of the good or service, then of course the customer will benefit. However, when two relatively large organisations combine, it may result in a newly merged business with considerable market power. With a fall in the price elasticity of demand for its goods and services, this bigger company may be able to increase its prices and make greater revenues.
An important responsibility of a taxpayer-funded competition authority is to make judgements about whether or not large M&As are in the public interest. For example, the Competition and Markets Authority in the UK investigates deals if the target company has a UK turnover that exceeds £70 million, or if the newly combined business has a market share that is equal to or exceeds 25 per cent. If the CMA concludes that an M&A would lead to a substantial lessening of competition in the market, then it could prohibit the deal from taking place. This has only happened on 9 occasions in the last 12 years. If competition concerns are identified, it is far more likely that CMA will allow the deal to go ahead but with certain conditions attached. This has happened 29 times in the last 12 years and the conditions are referred to as remedies.
The CMA has recently published a report (Understanding past merger remedies) that attempts to evaluate the relative success of the various remedies it has used in 13 M&A cases.
Articles
Are big mergers bad for consumers? BBC News, Daniel Thomas (30/10/15)
Mergers and acquisitions madness may be about to stop The Guardian (11/10/15)
M&A deal activity on pace for record year The Wall Street Journal, Dana Mattioli and Dan Strumpf (10/08/15) [Note: if you can’t see the full article, try clearing cookies (Ctrl+Shift+Delete)]
Global M&A Volume Surpasses $4tr in 2015 YTD Dealogic, Anthony Read (04/11/15)
M&A Volumes Weaken in October despite Megadeals Financial Times, James Fontanella-Khan and Arash Massoudi (01/11/15)
The merger of Dell and EMC is further proof that the IT industry is remaking itself The Economist (12/10/15)
Questions
- Using a cost curve diagram, explain the difference between economies of scale and x-efficiency.
- Explain why a takeover or merger might reduce the price elasticity of demand for the goods or services produced by the newly combined firm.
- Explain how the CMA determines the size of the appropriate market when calculating a firm’s market share.
- Draw a diagram to illustrate the simultaneous impact of greater market power and lower average costs that might result from a horizontal merger. Consider the impact on consumer, producer and total surplus.
- What is the difference between a structural and a behavioural remedy?
 The proposed $100 billion takeover of SABMiller by AB InBev is the third largest in history. It provides a good example of how the UK Panel on Takeovers and Mergers operates.
Economics textbooks often discuss competition authorities such as the Competition and Markets Authority but they rarely mention the UK Panel on Takeovers and Mergers (The Panel).The Panel is an independent body that was established in 1968. It has up to 35 members who all have professional expertise on the subject of takeovers i.e. they are usually employees of or have been seconded from (i) law and accountancy firms (ii) corporate brokers (iii) investment banks.
The Panel’s main responsibility is to implement the City Code on Takeovers and Mergers. This code sets out a number of ground-rules that companies must follow if they are involved in a merger or takeover. These rules became statutory in 2006 following the Companies Act of that year. The following objectives underpin the code:
|
|
| • |
To ensure that the shareholders of the target company in a proposed takeover are treated fairly and are given the opportunity to make an informed decision about the relative merits of the takeover. |
| • |
To ensure that the whole takeover/merger process operates in a structured and systematic manner. |
The Panel does not make any judgements on the commercial case for the takeover or merger. This is left to the management and shareholders of the companies involved. It also does not get involved with competition issues such as whether the newly established firm would have significant market power. These decisions in the UK are left to the Competition and Markets Authority. If the merger has a European element/dimension to it then it is investigated by the European Commission.
The rules that made up the code remained largely unchanged from 1968 until some important changes were made in September 2011. This followed the controversial takeover of Cadbury by the US food company Kraft. Kraft had first announced its intention to make an offer to acquire Cadbury in September 2009 but a deal was not agreed by the management of Cadbury until January 2010. Concerns were expressed at the time that this long and protracted takeover had made it very difficult for Cadbury to run its business effectively because of the uncertainty it created. It was also argued that the rules gave the acquiring company a significant tactical advantage in the takeover process and made it too easy for them to succeed.
One important change is that a targeted company must publicly announce the name of any companies that have made an approach about a possible deal. This announcement then activates a 28 day bid deadline period known as ‘pusu’ which stands for ‘put up’ (the money: i.e. make a formal bid) or ‘shut up’ (and walk away). This means that if the potential acquirer has not made a formal bid by the end of this 28-day period it is prohibited from making a bid for another 6 months. A request can be made to the Takeover Panel for an extension to this initial 28-day period, but this can only be done with the agreement of the target company.
Therefore SABMiller was obliged to announce on 15th September 2015 that
“Anheuser-Busch InBev SA/NV (AB InBev) has informed SABMiller that it intends to make a proposal to acquire SABMiller. No proposal has yet been received and the Board of SABMiller has no further details about the terms of any such proposal.”
The timing of this announcement made 14th October the official deadline by which AB InBev had to make a formal offer. After rejecting five bids, an offer of £44 a share by AB InBev was agreed in principle by the SABMiller management team on 13th October.  Given the size and complexity of the deal (i.e. AB InBev is financing the deal by borrowing over $70 billion from 21 different banks), an initial two-week extension until 28th October was granted by the Takeover Panel. This could only have been granted with the agreement of SABMiller. Another one-week extension was agreed and then, on 4th November, SABMiller management made the following announcement.
“In order to allow SABMiller and AB InBev to finalise their discussions and satisfy the pre-conditions to the announcement of a formal transaction, the board of SABMiller has requested that the Panel on Takeovers and Mergers further extends the relevant deadline until 5pm November 11, 2015.”
One major issue has been the potential impact of the takeover on the level of competition in the US market. AB InBev and SABMiller already have market shares of 46% and 27% respectively. SABMiller’s strong presence in this market is a result of its joint venture, MillerCoors, with Molson Coors. One reason behind the last request for an extension is to grant enough time for a deal to be finalised for the sale of SABMiller’s 58% stake in MillerCoors to Molson Coors. Without this sale the US competition authorities would not approve the takeover.
Most observers believe that it will take a year for the deal to be completed and it will be interesting to chart its progress over the next 12 months.
Postscript: AB InBev announced on 11th November that it had made a formal offer of £71 billion to acquire SABMiller and SABMiller’s share in MillerCoors had been sold to Molson Coors for $12 billion.
SABMiller to seek another Takeover Panel extension for AB InBev takeover The Telegraph, Ben Martin (04/11/15)
AB InBev and SABMiller allay concerns about 68bn MegaBrew deal The Telegraph, Ben Martin (28/10/15)
AB InBev, SABMiller extend takeover deadline to Nov.4 Reuters, Philip Blenkinsop (28/10/15)
SABMiller agrees AB Inbev takeover deal of £68bn The Guardian, Sean Farrell (13/10/15)
SABMiller is AB Inbev’s toughest takeover yet. It may not be its last The Economist (14/10/15)
Brewery Battle: AB Inbev and the Craft Beer Challenge BBC News, Peter Shadbolt (13/10/15)
Beer Giants AB Inbev and SABMiller Agree Takeover Terms BBC News (13/10/15)
Questions
- The proposed takeover of SABMiller by AB InBev would be the third largest in history. What are the two biggest deals?
- The European Commission investigates ‘large’ mergers that have an ‘EU dimension’. On what basis does the European Commission judge if a merger is large or has an EU dimension?
- On what basis are mergers judged by the Competition and Markets Authority in the UK?
- What is a ‘virtual bid’ period? How did the ‘pusu’ bid deadline operate before the changes were introduced in 2011?
- Pfizer’s bid for Astrazeneca did not succeed in May 2014. Some people blamed the collapse of the deal on the 28-day ‘pusu’ deadline and rule 2.5 (i) of the code. What is rule 2.5 (i) and how did it contribute towards the failure of this deal?
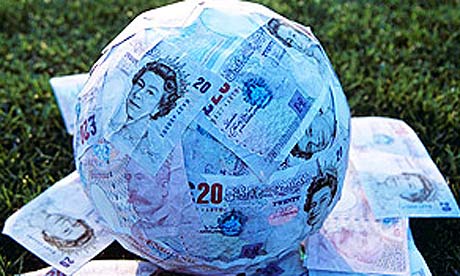 Deloitte recently published its 24th Annual Review of Football Finance and it contained some surprising results. Historically, most teams in the English Premier League (EPL) have made accounting losses with any increases in revenues being offset by higher wage costs. However, this report found that in 2013–14 most teams in the EPL actually made accounting profits.
The Deloitte’s review reported that the combined operating profits of clubs in the EPL increased from £82 million in 2012–13 to £614 million on 2013–14 – an enormous increase of 649%. Nearly all of the teams (19 out of 20) in the league made an operating profit while 14 also reported pre-tax profits. Dan Jones, head of Deloitte’s Sports Business Group, commented that:
“The change in club profitability in 2013–14 was more profound than anything we could have forecast.”
Why has the profitability of teams in the EPL suddenly improved so dramatically? One important factor was the significant increase in revenue. The combined income of the teams was £3.26 billion in 2013–14 – an increase of £735 million, or 29% on the previous year. Although match-day and commercial revenue both increased, the majority of this growth in income (nearly 80%) came from the sale of broadcast rights. The 2013–14 season was the first year of a new three-year contract that raised over £1.7 billion per year from the sale of these rights in both the UK and overseas.
However, clubs in the EPL have received big increases in revenue from TV deals before and still made substantial accounting losses. For example, the broadcasting contract that ran from 2010–13 generated over £1.1 billion per season – a £243 million per annum increase on the previous deal. Significantly, in the first year of this deal (2010–11), 81% of this increase in revenue went straight into higher player salaries, whereas in 2013–14 this figure was only 16%. The ratio of wages to turnover also fell from 71% in 2012–13 to 58% in 2013–14
So why did a smaller proportion of the increase in revenue go to the players compared with previous years? The explanation appears to be the impact of two new controls and regulations that were implemented by the EPL at the beginning of the 2013–14 season.
One of these has received considerable media attention and is similar to UEFA’s Financial Fair Play regulations. The Profitability and Sustainability Rules allow the clubs to make a maximum cumulative loss of £105 million over three seasons before having to face sanctions from the league. The size of the permissible loss is significantly higher than in the UEFA regulations.
The other control that has received far less attention is called Short-Term Cost Control (STCC). This regulation places limits on the extent to which clubs can increase their total wage bill. It operates from 2013–14 to 2015&ndash16: i.e. it covers the same three years as the current TV deal. For the 2013–14 season it worked in the following way.
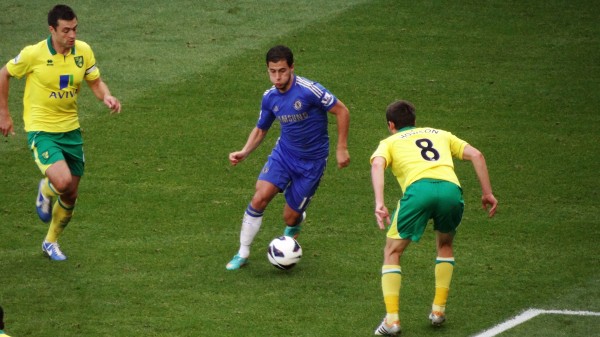
If teams had a wage bill of less than £52 million they faced no restrictions on their spending on players’ salaries. Only Crystal Palace (£46 million) and Hull City (£43 million) fell into this category. Unsurprisingly, the five biggest spending clubs, Man Utd, Man City, Chelsea, Arsenal and Liverpool, had much greater wage bills of £215m, £205m, £192m, £166m and £144m respectively.
Any of the 18 teams that exceeded the £52m limit would still not face sanctions if their wage bill increased by £4 million or less. For example, Stoke City’s wage bill only increased from £60m to £61m, while Tottenham Hotspur’s increased from £96m to £100m. Some clubs actually managed to reduce their total wage bill, including the champions, Manchester City, which managed to lower its from £233m to £215m.
However, there were still 12 teams with a total wage bill that was greater than £52 million in 2013–14 and which had increased by more than £4 million on the previous year. For these teams not to face any sanctions, they had to prove to the EPL that any of the increase above £4 million was either due to player contracts entered into before January 2013 or could by financed from the following two sources.
• Club Own Revenue Uplift
• Profit from player transfers
Whereas the profit from player transfers is straightforward, the ‘Club Own Revenue Uplift’ requires some explanation, as it excludes a very important part of teams’ incomes – Central Fund payments.
Some revenues earned by clubs in the EPL are referred to as ‘Central Fund payments’. These are, in effect, income payments from money that is raised centrally by the EPL on behalf of the clubs and then distributed to the teams using an agreed formula. The majority of the revenue generated under this category is from the broadcast deals, although some commercial income, such as the sponsorship of the league, also falls under this category. For some teams the money raised from Central Fund payments makes up the majority of their revenue.
‘Club Own Revenue’ in STCC calculations refers to all revenues other than those from Central Fund payments. This includes a number of income streams that the club has more direct control over. They include:
• Gate money/other match-day revenue
• Commercial deals negotiated by the individual club
• Income from playing in European competitions, including TV revenue.
The uplift refers to increases in revenue from these sources compared to 2012–13.
For example, assume a club has made no profit from its transfer dealing and did not enter into any significant player contracts prior to January 2013. If this club’s wage bill increased from £100m in 2012–13 to £110m in 2013–14 then it would have to provide evidence to show that £6m of this increase could be financed from growth in its Club Own Revenue. In other words, it would have to demonstrate how its income from gate money, commercial deals and playing in Europe was at least £6m higher in 2013–14 than it had been in 2012–13.
It will be interesting to see if (1) the profitability of the clubs continues to improve in future years and (2) the STCC regulations are extended when the new broadcast deal comes into effect in 2016–17.
The EPL Proves Cost Control Works The Judge 13 (4/6/15)
English Premier League clubs made more revenue than Spain and Italy’s clubs combined UK Business Insider, Lianna Brinded (4/6/15)
Premier League football club revenues and profits soar BBC News, Bill Wilson (4/6/15)
Deloitte Premier League list: Clubs’ revenue boom to £3.3billion as Tottenham record highest ever pre-tax profits after Gareth Bale transfer The Independent, Joanna Bourke (4/6/15)
Annual Review of Football Finance 2015 Premier League clubs generate over £3bn revenue in season of records Deloitte (4/6/15)
Premier League top of the rich list with record income of £3.26bn The Guardian, David Conn (4/6/15)
Questions
- What is the difference between an operating profit and a pre-tax profit?
- If a club reports that it is making an accounting profit, does this mean that it must be making an economic profit? Explain your answer.
- Give some examples of the economic costs of running a football club that might not be included in accounting calculations of profit.
- How is the profit/loss from player transfers calculated?
- Explain why the current rules may give teams that play in European competitions a competitive advantage.
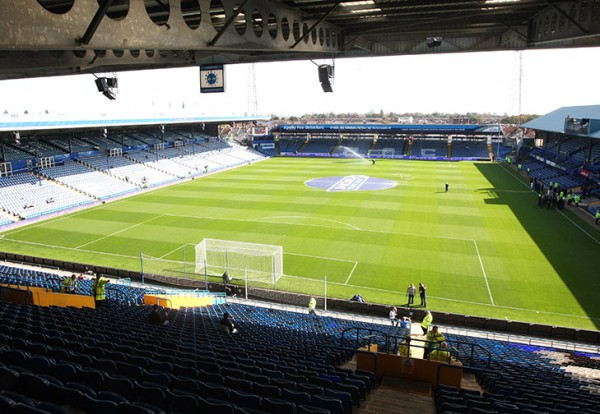 Most observers were once again left stunned by how much media companies are willing to pay to secure the rights to broadcast live games in the English Premier League (EPL). At the same time the method used to sell those rights is being investigated by Ofcom following complaints made by Virgin Media. Virgin Media actually requested that the auction was halted until the investigation was completed.
Between them, BSkyB and BT Sport have paid £5.136bn to purchase the rights to broadcast live matches in the EPL over a three-year period beginning in the 2016–17 season. This is a 71% increase in the price paid for the previous three-year deal which runs from 2013 to 2016 and cost £3.018bn. However, the headline figure hides some big differences between the amounts paid by the two companies.
How exactly are the rights sold? The broadcast rights for the 168 live matches are split up into seven different packages labelled A through to G and are placed in seven different auctions. The type of auction used by the EPL is a sealed bid auction. Interested companies are invited to make an offer for any of the packages. However, when they make a bid they do not know (a) if other firms have also made a bid and (b) the size of any other bids. Another constraint is that one firm is not allowed to win more than five of the auctions. When the auction finishes the EPL only releases information about the winning offers. It never provides information about any of the failed bids.
Some of the packages are worth more than others to the broadcasters. The first five packages (A–E) each contain the rights for 28 games per season, while the other two packages (F and G) contain the rights for 14 matches. In some of the packages all of the games kick off at the same time and on the same day. For example all 28 games in package ‘A’ kick off at 12.30pm on a Saturday. Others contain more of a mixture. Some of the games in Package E take place on a Monday evening. while others take place on a Friday evening. Given the potential advertising revenue and number of viewers, the most valuable package is D, which has 28 games that kick off at 4.00pm on a Sunday.
Another factor that influences the value of a package is the number of ‘first picks’. In any given week, more than one broadcaster might want to screen the same match. To overcome this problem, each package is allocated a number of first, second, third, fourth and fifth ‘picks’. For example, package D comes with 18 first and 10 fourth round picks. This means that whichever company wins this package will get first choice on the games they want to broadcast on 18 occasions a year. Package C contains no ‘first picks’ but offers 15 second, 4 fourth and 7 fifth round picks. There is also a maximum and a minimum limit on the number of times games including a specific team can be broadcast.
BSkyB won the auctions for packages A, C, D, E and G for a price of £4.17bn. This means that it will be paying £1.396bn to broadcast 126 live games per season. This is an average payment of £11,031,700 per game. In the previous deal it paid £760million for the rights to broadcast 116 live games per season. This is an average payment of £6,551,724 per game. The new deal represents a cost increase of 68% per game. However, the number of first picks BskyB has secured in the new deal increases from 20 to 26.
BTSport won the auctions for packages B and F for a price of £960m. This means that it will be paying £320m for the rights to broadcast 42 live games per season. This is an average payment of £7,619,048 per game. In the previous deal it paid £246 million per year for the rights to broadcast 38 live games per season. This is an average payment of £6,473,684 per game. The new deal represents an increase in costs of 17.7% per game for BT Sport – a much lower figure than for BSkyB.
BSkyB has stated that it will cover the increase in the price it has paid for the rights with efficiency savings. However, many observers believe that it will ultimately result in significant increases in the subscription rates for SkySports. The impact of the deal on BskyB’s profit may well depend on the willingness of its customers to pay higher prices. What is the price elasticity of demand for SkySports at the current subscription rates they are charging?
There is still some uncertainty about the deal following Ofcom’s decision to investigate the legitimacy of the method used by the EPL to auction the rights. Virgin Media made a formal complaint in September 2014 about the collective selling of the live broadcast rights and argued that it was in breach of competition law. The investigation by Ofcom will make a judgment about whether the joint selling of the rights by the EPL is a contravention of Chapter I of the Competition Act 1998 and/or Article 101(1) of the Treaty on the Functioning of the European Union. An initial announcement will be made in March.
Premier League set to announce record £4.4bn TV rights deal BBC Sport (10/2/15)
Premier League TV rights: What does deal mean for fans & clubs BBC Sport, Ben Smith (11/2/15)
How Sky paid £4m more per Premier League match than BT The Telegraph, Ben Rumsby (11/2/15)
Premier League TV deal: Windfall must benefit grass roots and England The Telegraph, Henry Winter (10/2/15)
Sky and BT retain Premier League TV rights for record £5.14bn The Guardian, Owen Gibson (10/2/15)
Premier League TV rights: Sky Sports and BT Sport win UK broadcasting rights as price tops £5billion Independent, Tom Peck (10/2/15)
Questions
- Draw a demand curve for package A and package D of the live broadcast rights. Which one do you think will be furthest to the right? Explain your answer.
- What are the potential benefits to the EPL of not revealing the details of any of the losing bids?
- Explain how the price elasticity of demand is a useful concept for assessing the impact of the new deal on the profits of BSkyB and BTSport.
- Given the impact of the new deal of the size of Parachute payments, what impact might it have on the level of competitive balance in the Championship?
- Find out the key provisions of Chapter I of the Competition Act 1998 and Article 101(1) of the Treaty on the Functioning of the European Union.
 An annual event takes place every October that leads to a large number of frustrated consumers – the sale of tickets for the Glastonbury festival. This year the sale of standard tickets began at 9.00am on Sunday 5th October. Within 27 minutes all of the 120,000 tickets had been sold and it was reported that over a million people had tried to access the website. Social media was full of messages from disappointed fans that had been unable to get a ticket.
The Glastonbury festival has grown in popularity and the organisers adopted a unique way of selling the tickets a number of years ago. They introduced a system that made it impossible for people to purchase tickets unless they had previously registered. Although there is no charge to register, in order to complete the process successfully, people have to submit a clear passport style photograph in Jpeg format. Once registered, customers are allocated a unique registration number which they must submit in order to purchase a ticket when they go on sale. Each buyer can purchase up to a maximum of 6 tickets and must provide a valid registration number for each separate ticket they obtain. Successful applicants receive a personalised ticket, including their photo, which cannot be re-sold. The organisers have been very clear about the rationale for introducing this scheme. They have stated that it is part of their
“on-going efforts to cut out ticket touting”
However a number of people have criticised the ticket sale process. These criticisms tend to fall into two key areas: first, the method used in the initial sale process and second, the constraints placed on resale after a ticket has been purchased.
The tickets are sold by the company SeeTickets and their Head of Business Development stated in an interview in 2013 that:
 There is something like 1,100,000 customers registered to go to Glastonbury, and they all want a ticket. It’s a shame but there is nothing you can do about it. The 900,000 people that don’t get to go often come up with the argument, why don’t you just have a ballot? Why don’t we just register and a computer generated ballot just picks the winners? I think they’ve (Glastonbury) always had a view that if you get a ticket to Glastonbury there’s an element of work that you have to do to achieve that and it does reward that commitment. I think there’s a sense that if you use a ballot then maybe you’d get some people who were not as committed.
However responding to these comments a customer commented that:
I’ve been lucky in the past and got tickets within minutes and like this year tried all morning and come away empty handed. Whether I have been successful has nothing to do with hard work but the vagaries of the internet and a bit of luck.
Another customer commented:
No ballot! It’s too random. People who really,really want to go should get the tickets, so the only fair way is regional ticket sales, where you could queue ( overnight if required) to get your ticket. This is the only fair way. Year after year genuine fans miss out. This way fans who are willing to make an effort get the chance, rather than a ballot or the random computer system which they have at present.
Others have criticised the limited ability consumers are given to resell their tickets. The full cost of a ticket for the 2015 festival is £220 plus a £5 booking fee. When the tickets are originally sold in October, the buyers have to pay a £50 deposit and at this point none of the bands playing at the festival have been announced. The remaining balance of £175 is due at the beginning of April by which point some of the bands/acts will have been confirmed. Anyone who decides not to pay the balance or cancel their order before this date is refunded their deposit, minus an administration fee. Those tickets are then put forward for re-sale. The re-sale process typically takes place at the end of April and once again is only open to people who have previously registered. Last year 10,000 tickets were re-sold in just 12 minutes! Once this period in April is over the re-sale of tickets is prohibited even though the complete line-up for the festival may not have been confirmed.
The secondary ticket company Viagogo reported the results from research they had carried out on the 2014 festival. This found that following the relatively late announcement of Metallica as one of the headline acts,78% of people who had bought a ticket said they would have resold it if they’d had the chance.
A spokesperson from Viagogo stated that:
We believe that once you’ve bought a ticket it’s yours and if you want to sell it or give it away, you should be allowed to do so. In this case, with an unpopular headline act announced late, ticket holders lose out because they can’t resell their tickets and Metallica fans lose out because they can’t buy them.
Those people who either did not get a ticket or are left with a ticket they would rather re-sell will no doubt continue to complain about the ticket selling process.
The economics of GlastonburyThe Economist (24/6/14)
Handbag Economics: How much Glastonbury will really cost you Handbag Economics (12/6/14)
Should Glastonbury Festival tickets go to the ballot? Virtual Festivals (8/10/13)
Glastonbury 2014: Four in five fans wanted to resell tickets after Metallica announcement The Independent (26/6/14)
Third of Glasto fans put-off by strict ‘no ticket resale policy’ – but 2015 is still a sell-out The Mirror (6/10/14)
“People wanted to sell Glastonbury tickets!” says ticketing website Bad PR (3/7/14)
The pain of Glastonbury tickets – in two charts The Mirror (6/10/14)
Questions
- What is the opportunity cost of going to the Glastonbury Festival? Discuss some of the non-ticket factors you have included in your calculations.
- Draw a demand and supply diagram to illustrate the market for Glastonbury tickets. NB think carefully about the shape of the supply curve in both the short-run and the long run. Is the current price of a ticket at the market clearing level? Explain your answer.
- The sale and re-sale of tickets takes place before the all the headline acts have been announced. Illustrate what will happen to the demand curve for consumers with different preferences once the headline acts have been announced.
- Assess the relative costs and benefits of using a ballot instead of the current system used by the festival organisers to sell of tickets.
- The organisers of the festival introduced the registration process in order to limit the re-sale of the tickets. Analyse the impact of this policy on Pareto and allocative efficiency? Will the policy cause any deadweight welfare loss? What factors will determine the size of any deadweight welfare loss?
- Suggest some reasons why care may need to be taken when using the results from the research carried out by Viagogo.
 Global merger and acquisition deals with a combined value of £2.7 trillion ($4.06 trillion) have taken place so far this year (1 Jan to 3 Nov). This is a 38% increase on the same period in 2014 ($2.94 trillion) and even surpasses the previous record high for the same period in 2007 ($3.93 trillion) (see the chart from the Dealogic article linked below).


