 Wikipedia is a free on-line encyclopedia which is compiled and maintained by some of the people who use it regularly. It has been estimated that on any given day 15% of all internet users visit the website. Anyone can write new articles or edit existing material. The encyclopedia has over 5 million entries. So how is it financed?
If you visit the Wikipedia website at the moment you will be greeted by the following message:
DEAR READERS, We’ll get right to it: This week we ask you to help Wikipedia. To protect our independence, we’ll never run ads. We’re sustained by donations averaging about £10. Only a tiny portion of our readers give. If everyone reading this right now gave £2, our fundraiser would be done within an hour. That’s right, the price of a cup of coffee is all we need. We’re non-profit with costs of a top website: servers, staff and programs. We believe everyone should have access to free knowledge, without restriction or limitation. If Wiki We believe everyone should have access to free knowledge, without restriction or limitation. If Wikipedia is useful to you, please take one minute to keep our work going another year. Thank you.pedia is useful to you, please take one minute to keep our work going another year. Thank you.
Wikipedia Foundation, the not-for-profit company that manages the Wikipedia website, has been running these donation drives for a number of years. The 2014/15 financial year was their most successful to date as 4 million donations were made by people from all over the world.  A total of $75 million was raised compared with $15 million in 2009/10. Although the average contribution was $15.20 in 2014/15, some people contributed over $250,000!
Many of you studying economics might find these figures surprising as Wikipedia would appear to have some of the characteristics associated with public goods. On the one hand, the material is perfectly non-rival. If someone decides to read an entry on Wikipedia it does not prevent other users from being able to read the same article. The article does not get used up or depleted in the act of being read. On the other hand, however, it is possible to exclude non-payers from gaining access to the material. For example in June 2010, the Times and Sunday Times introduced a subscription service for access to on-line versions of the newspapers. The New York Times recently announced that it had one million digital subscribers. However given its non-rivalrous nature, material could be shared between payers and non-payers. Groups of people could even get together and share one subscription.
The statement provided by Wikipedia clearly expresses the importance it attaches to free access. Given that it is non-rivalrous in consumption and free of charge to all users, does economic theory predict that people will (i) make voluntary monetary donations (ii) contribute and edit the on-line entries?
If all users are driven by narrowly self-interested preferences and act in a rational manner, then they will not pay and no donations will be made. People will choose to free ride as they can read exactly the same material whether they have paid for it or not.
Given the results of the fund-raising drive are so at odds with this prediction, it suggests that a significant number of Wikipedia users have either altruistic preferences and/or respond to social norms.
 If a rational self-interested person receives no monetary payment for writing or editing an entry would they ever contribute to the website? Given the effort involved it would seem highly unlikely. However the Wikipedia website claims that over 125,000 people contribute regularly. They are referred to as ‘Wikipedians’.
One possible explanation for this behaviour is that some individuals gain utility/pleasure from other people reading and finding their entries both useful and interesting. This utility might increase with the number of potential readers. Therefore keeping access free is a motivating factor for a number of contributors as it maximises the potential readership of their entries. However, the number of contributors fell by a one third between 2007 and 2014.
An interesting question is whether the quantity and quality of contributions would increase if Wikipedia implemented a subscription service which generated enough revenue to enable contributors to be paid but also significantly reduced the number of users.
An alternative way of generating revenue would be to allow advertisements on the website while keeping access free of charge. This option has been resisted so far.
Articles
The Wikipedia fundraising banner sad but untrue Wikipediocracy, The Masked Maggot and friends (11/12/2014)
Newsonomics:10 numbers on the New York times 1 million digital-subscriber milestone Nieman. Ken Doctor (6/8/2015)
The trouble with “Free Riding” Freedom to tinker, Timothy B. Lee (24/8/2008)
The future of Wikipedia: Wikipeaks? The Economist (1/3/2014)
Wikimedia publications
Fundraising report 2014-2015 Wikimedia foundation (26/10/2015)
Wikipedia community
Questions
- How do economists classify goods or services that have a low degree of rivalry but where it is relatively easy to exclude non-payers? Give some real world examples to illustrate your answer.
- How do economists classify goods and services that have a high degree of rivalry but where it is relatively difficult to exclude non-payers? Give some real world example to illustrate your answer.
- Explain why an economically rational individual might still make a donation towards the running of the Wikipedia website.
- Why do you think the number of contibutors has fallen?
- People often complain that Wikipedia entrees are badly written and contain numerous mistakes. To what extent do you think that paying contributors would help to overcome this problem?
- What are the possible advantages/disadvantages of financing Wikipedia by using advertising revenue?
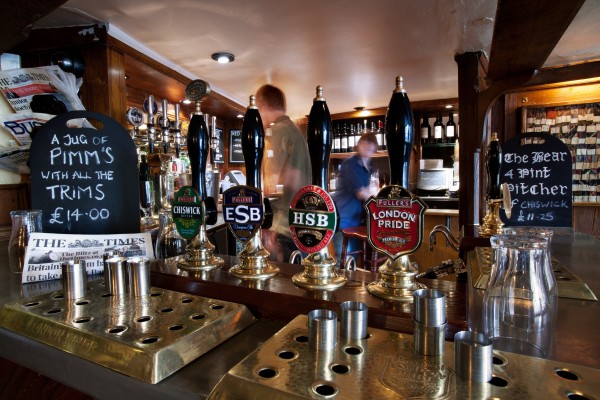 Pubs are closing down in the UK at the rate of 29 per week. The total number has fallen from 67,000 in 1982 to approximately 52,000 this year. In response to this decline the government has recently announced some changes to the way the relationship between pub owners and their tenants are regulated.
The ownership of pubs in the UK changed dramatically after a report on the beer market was published by the Monopolies and Mergers Commission (MMC) in 1989. When this investigation took place over 75% of the beer in the UK was produced by the six largest brewing businesses (Bass, Allied Lyons, Grand Metropolitan, Whitbread, Scottish and Newcastle, Courage) which owned over half the pubs. The nature of the relationship between these breweries and the landlords of the pubs they owned caused the greatest concerns.
Some pubs are run as managed houses. In this type of business relationship the person who manages and runs the pub (the publican) is a direct employee of the brewery. However, in many instances this is not the case. Instead they are independent entrepreneurs who enter into a tenancy agreement with the owner of the pub. In other words they rent the pub from the brewery and have some freedom over the way it is run including the setting of prices.
These arrangements have proved to be very controversial because of one particular aspect of many of the tenancy agreements – the exclusive supply contract. Known as the ‘tied lease model’, ‘beer tie’ or ‘wet rent’, it significantly reduces the freedom of publicans to run the business, as they have to purchase almost all their beverages from the brewery that owns the pub.
The MMC report in 1989 concluded that a significant reason for the increasing real price of beer was the market power exerted by the brewers through the tied lease model. It recommended that the number of pubs owned and operated by the brewers should be substantially reduced. Known as the ‘Beer Orders’, the brewers responded by gradually selling off 14,000 pubs. They also eventually sold the breweries to international rivals and companies such as Whitbread and Bass moved into the retail, leisure and hotel sectors. Whitbread currently owns Costa, Brewers Fayre and Premier Inn hotels while Bass, renamed Intercontinental Hotels Groups, owns both Crown Plaza and Holiday Inn hotels.
 The beer tie between the pubs and the big national breweries might have disappeared but the tied lease arrangement still exists. Instead of being tied to national brewers, many publicans are tied to either smaller regional breweries, such as Everards and Adnams, or another type of business – the pub company known as ‘pubcos’. Some of the larger pubcos include Enterprise Inns, Punch Taverns, Mitchells&Butlers and JD Weatherspoon. They negotiate deals with the breweries and then supply the beer to their pubs.
In 2014, The British Beer and Pub Association estimated that two-fifths of pubs in the UK were owned by pubcos, while another fifth were owned by regional breweries. In 2013, The Department for Business, Innovation and Skills estimated that 48 per cent of pubs in the UK had landlords who were tied to either a regional brewer or a pub company.
The ownership of pubs may have changed radically over the past 20 years but the tied lease system continues to be extremely controversial. The main argument against the system is that it leads to tied publicans having to pay significantly above free market prices for their beer. The pubcos accept this claim but maintain that, in return for being in a tied lease, the publican pays a lower rent and receives business support services.
Parliament passed the Small Business, Enterprise and Employment Act in March 2015 (see Part 4). This included provisions for the introduction of:
|
|
| • |
a statutory Pubs Code to govern the relationship between the businesses that own the pubs and their tenants; |
| • |
a new independent Adjudicator to enforce the code; |
| • |
a Market Rent Only (MRO) option. |
In October 2015 the government announced some proposals for how the MRO option could be implemented as part of its consultation process with the industry. These include giving the tied publican the right to ask for a rent assessment every five years or whenever the owner of the pub significantly changes the beer prices it charges the tenant. As part of this rent assessment the publican can take the option to switch to an MRO contract. This gives them the freedom to purchase beer from any supplier rather than being tied to those supplied by the owner of the pub.
Enterprise Inns, the largest pubco, operates nearly all of its pubs on the tied lease model. In response to the changes proposed by the Government, the company has announced plans significantly to increase the number of its directly managed pubs from just 16 to 800.
Could the tied lease system finally be about to end?
Articles
Enterprise Inns to grow pub numbers after death of the ‘beer tie’ The Telegraph, Ben Martin, and Peter Spence (12/05/15)
What is the ‘beer tie’ The Telegraph, Denise Roland (19/11/14)
Q&A: Calling time on the beer tie BBC News, Katie Hope (19/11/14)
Chin chin! Fair deal for pub tenants under a new beer tie crackdown City AM, Suzie Neuwirth (29/10/15)
Industry Reacts to New Statutory Pubs Code Eat Out, Nathan Pearce (29/10/15)
What does new pub code mean for the leased pubs? Burton Mail, Andrew Musgrove (04/11/15)
Questions
- What has happened to the big six national brewers which once dominated the beer industry in the UK?
- What factors have caused the decline in the number of pubs?
- Using a diagram, illustrate the impact that the market power of the pubcos might have on the prices paid by publicans in a tied lease.
- Discuss some of the potential advantages of the tied lease model.
- The global brewers and pubcos might create a situation where market power exists in successive stages of the vertical supply chain. Analyse some of the potential implications of this structure and discuss the concept of double marginalisation.
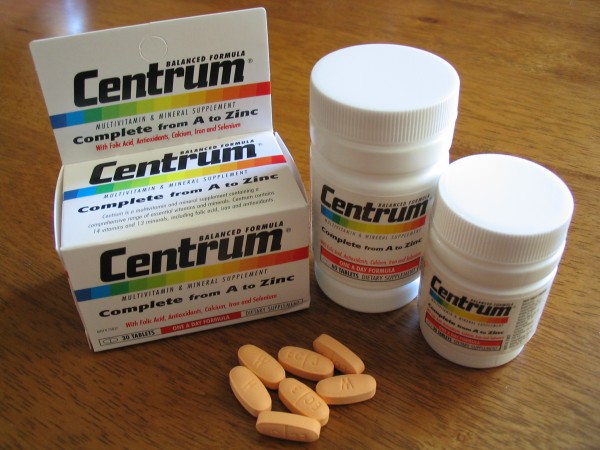 On Monday 23rd November, the US based pharmaceutical business Pfizer (producer of Viagra) announced that it had reached a $160 billion deal to acquire the Irish based pharmaceutical business Allergan (producer of Botox). If it is successful it will be the third largest deal in takeover history.
In a previous blog on this website a number of reasons were discussed to explain why businesses may engage in mergers and acquisitions (M&As) Are large mergers and acquisitions in the interests of the consumer . These include market power, access to growing markets, economies of scale and reducing x-inefficiency. One of the interesting things about the Pfizer and Allegan deal is the importance of another factor that was not discussed in the article – tax avoidance.
Rates of corporation tax vary considerably between countries and may deter some businesses from operating in the US where it is at the relatively high level of 35%. This compares with a rate of 20% in the UK, 12.5% in Ireland and 0% in Bermuda. The global average rate is 23.7% whereas the average across EU countries is 22.2%.
However, a far bigger incentive for a US firm to merge with or acquire businesses in other countries is the unusual way the US authorities tax profits. Most countries use a territorial system. This means that tax is only paid on the profit earned in that country. For example if a UK multinational business has subsidiaries in other countries it only pays corporation tax in the UK on profits earned in the UK. The profits earned by its subsidiary businesses would be taxed at the rate set by the government in the country where they were located.
The US authorities use a worldwide system. This means that profits earned by a subsidiary in another country are also taxed in the US. This is best explained with the help of a simple numerical example.
Assume a US multinational earns $100,000 in profits from a subsidiary based in Ireland. These profits will be taxed in Ireland at the rate of 12.5% and the company would have to pay $12,500 to the Irish government. If that profit was returned to the US it would be taxed again at a rate of 22.5%: i.e. 35% – 12.5%. The company would have to pay the US authorities $22,500.The worldwide system means that the total rate of tax paid by the firm is 35% but it is split between two different countries. If the territorial system was used, the firm would only pay the $12,500 to the Irish government.
So how could M&As change things? If an M&A enables a US multinational business to change its country of incorporation (i.e. move the address of its headquarters) from the US to another country that operates a territorial system its payments will fall. This is sometimes referred to as tax inversion. As the Bloomberg columnist Matt Levine stated:
If we’re incorporated in the U.S., we’ll pay 35 percent taxes on our income in the U.S. and Canada and Mexico and Ireland and Bermuda and the Cayman Islands, but if we’re incorporated in Canada, we’ll pay 35 percent on our income in the U.S. but 15 percent in Canada and 30 percent in Mexico and 12.5 percent in Ireland and zero percent in Bermuda and zero percent in the Cayman Islands.
 As a result of the merger with Allergan, Pfizer will move the address of its headquarters to Ireland even though its global operations and executives will still be based in New York. It has been estimated that this will generate a one off tax saving of $21 billion as Pfizer would avoid having to pay US taxes on $128 billion of profits generated by its non US subsidiaries.
A number of US politicians have condemned the proposed deal. For example Hilary Clinton stated:
This proposed merger, and so called inversions by other companies, will leave US taxpayers holding the bag.
Twenty US companies have moved their headquarters to countries that operate a territorial system of taxation since 2012. These include Burger King’s move to Canada and Medtronic’s move to Ireland.
The US government has tried to tighten the rules but the two major parties disagree about how to deal with the problem.
Articles
Pfizer Seals $160bn Allergan deal to create drugs giant BBC News,(23/11/15)
Pfizer’s $160bn Allergan deal under pressure in the US BBC News,(24/11/15)
Pfizer set to buy Allergan in $150bn historic deal The Telegraph,(23/11/15)
Pfizer and Allergan poised to announce history’s biggest healthcare merger-corporate-tax The Guardian,(22/11/15)
Pfizer takeover: what is a tax inversion deal and why are they so controversial? The Guardian,(23/11/15)
Questions
- The newly merged business would jump above Johnson and Johnson to become the world’s largest biotech and pharmaceutical company in the world. Who are the other biggest eight Biotech and pharmaceutical businesses in the world?
- What exactly is a subsidiary? Give some real-world examples.
- How have the US authorities changed the rules in an attempt to deter tax inversions?
- Assume that a US multinational makes $1 million profit in the US and $1 million profit from its subsidiary in Ireland. Explain how changing its country of incorporation from the US to Ireland will alter the amount of corporation tax that it has to pay.
 Global merger and acquisition deals with a combined value of £2.7 trillion ($4.06 trillion) have taken place so far this year (1 Jan to 3 Nov). This is a 38% increase on the same period in 2014 ($2.94 trillion) and even surpasses the previous record high for the same period in 2007 ($3.93 trillion) (see the chart from the Dealogic article linked below).
Measured by dollar value, October was the fifth biggest month in Mergers and Acquisitions (M&As) history with the announcement of $514bn of actual or proposed deals. These included:
|
|
| • |
the proposed £71 billion deal to acquire SABMiller (the world’s second largest brewer) by AB InBev (the world’s largest brewer); |
| • |
the $67bn takeover of network storage provider EMC by Dell (the world’s third largest computer supplier); |
| • |
the proposed deal to acquire Allergan (producer of Botox) by Pfizer (the producer of Viagra). |
Although the dollar value of M&As was extremely large in October the actual number of deals, 2177, was significantly lower than the average of 3521 over the previous 9 months.
Are these large M&As in the interests of the consumer? One advantage is that the newly combined firms may have lower average costs. Reports in the press, following the announcement of most M&As, often discuss the potential for reductions in duplicate resources and rationalisation. After the successful completion of a takeover two previously separate departments, such as finance, law or HRM, may be combined into one office. If the newly integrated department is (i) smaller than the previous two departments added together and (ii) can operate just as effectively, then average costs will fall. This is simply an example of an economy of scale.
Average costs will also decrease if x-inefficiency within the acquired business can be reduced or eliminated. X-inefficiency exists when an organisation incurs higher costs than are necessary to produce any given output. In other words it is not producing in the cheapest possible way. In a number of takeovers in the brewing industry, AB InBev has gained a fearsome reputation for minimising costs and removing any waste or slack in acquired organisations. In an interview with the Financial Times, its chief executive, Carlos Brito, stated that:
“In any company, there’s 20 per cent that lead, 70 per cent that follow and 10 per cent that do nothing. So the 10 per cent, of course, you need to get rid of.”
If any reduction in costs results in lower prices without any lessening in the quality of the good or service, then of course the customer will benefit. However, when two relatively large organisations combine, it may result in a newly merged business with considerable market power. With a fall in the price elasticity of demand for its goods and services, this bigger company may be able to increase its prices and make greater revenues.
An important responsibility of a taxpayer-funded competition authority is to make judgements about whether or not large M&As are in the public interest. For example, the Competition and Markets Authority in the UK investigates deals if the target company has a UK turnover that exceeds £70 million, or if the newly combined business has a market share that is equal to or exceeds 25 per cent. If the CMA concludes that an M&A would lead to a substantial lessening of competition in the market, then it could prohibit the deal from taking place. This has only happened on 9 occasions in the last 12 years. If competition concerns are identified, it is far more likely that CMA will allow the deal to go ahead but with certain conditions attached. This has happened 29 times in the last 12 years and the conditions are referred to as remedies.
The CMA has recently published a report (Understanding past merger remedies) that attempts to evaluate the relative success of the various remedies it has used in 13 M&A cases.
Articles
Are big mergers bad for consumers? BBC News, Daniel Thomas (30/10/15)
Mergers and acquisitions madness may be about to stop The Guardian (11/10/15)
M&A deal activity on pace for record year The Wall Street Journal, Dana Mattioli and Dan Strumpf (10/08/15) [Note: if you can’t see the full article, try clearing cookies (Ctrl+Shift+Delete)]
Global M&A Volume Surpasses $4tr in 2015 YTD Dealogic, Anthony Read (04/11/15)
M&A Volumes Weaken in October despite Megadeals Financial Times, James Fontanella-Khan and Arash Massoudi (01/11/15)
The merger of Dell and EMC is further proof that the IT industry is remaking itself The Economist (12/10/15)
Questions
- Using a cost curve diagram, explain the difference between economies of scale and x-efficiency.
- Explain why a takeover or merger might reduce the price elasticity of demand for the goods or services produced by the newly combined firm.
- Explain how the CMA determines the size of the appropriate market when calculating a firm’s market share.
- Draw a diagram to illustrate the simultaneous impact of greater market power and lower average costs that might result from a horizontal merger. Consider the impact on consumer, producer and total surplus.
- What is the difference between a structural and a behavioural remedy?
 The proposed $100 billion takeover of SABMiller by AB InBev is the third largest in history. It provides a good example of how the UK Panel on Takeovers and Mergers operates.
Economics textbooks often discuss competition authorities such as the Competition and Markets Authority but they rarely mention the UK Panel on Takeovers and Mergers (The Panel).The Panel is an independent body that was established in 1968. It has up to 35 members who all have professional expertise on the subject of takeovers i.e. they are usually employees of or have been seconded from (i) law and accountancy firms (ii) corporate brokers (iii) investment banks.
The Panel’s main responsibility is to implement the City Code on Takeovers and Mergers. This code sets out a number of ground-rules that companies must follow if they are involved in a merger or takeover. These rules became statutory in 2006 following the Companies Act of that year. The following objectives underpin the code:
|
|
| • |
To ensure that the shareholders of the target company in a proposed takeover are treated fairly and are given the opportunity to make an informed decision about the relative merits of the takeover. |
| • |
To ensure that the whole takeover/merger process operates in a structured and systematic manner. |
The Panel does not make any judgements on the commercial case for the takeover or merger. This is left to the management and shareholders of the companies involved. It also does not get involved with competition issues such as whether the newly established firm would have significant market power. These decisions in the UK are left to the Competition and Markets Authority. If the merger has a European element/dimension to it then it is investigated by the European Commission.
The rules that made up the code remained largely unchanged from 1968 until some important changes were made in September 2011. This followed the controversial takeover of Cadbury by the US food company Kraft. Kraft had first announced its intention to make an offer to acquire Cadbury in September 2009 but a deal was not agreed by the management of Cadbury until January 2010. Concerns were expressed at the time that this long and protracted takeover had made it very difficult for Cadbury to run its business effectively because of the uncertainty it created. It was also argued that the rules gave the acquiring company a significant tactical advantage in the takeover process and made it too easy for them to succeed.
One important change is that a targeted company must publicly announce the name of any companies that have made an approach about a possible deal. This announcement then activates a 28 day bid deadline period known as ‘pusu’ which stands for ‘put up’ (the money: i.e. make a formal bid) or ‘shut up’ (and walk away). This means that if the potential acquirer has not made a formal bid by the end of this 28-day period it is prohibited from making a bid for another 6 months. A request can be made to the Takeover Panel for an extension to this initial 28-day period, but this can only be done with the agreement of the target company.
Therefore SABMiller was obliged to announce on 15th September 2015 that
“Anheuser-Busch InBev SA/NV (AB InBev) has informed SABMiller that it intends to make a proposal to acquire SABMiller. No proposal has yet been received and the Board of SABMiller has no further details about the terms of any such proposal.”
The timing of this announcement made 14th October the official deadline by which AB InBev had to make a formal offer. After rejecting five bids, an offer of £44 a share by AB InBev was agreed in principle by the SABMiller management team on 13th October.  Given the size and complexity of the deal (i.e. AB InBev is financing the deal by borrowing over $70 billion from 21 different banks), an initial two-week extension until 28th October was granted by the Takeover Panel. This could only have been granted with the agreement of SABMiller. Another one-week extension was agreed and then, on 4th November, SABMiller management made the following announcement.
“In order to allow SABMiller and AB InBev to finalise their discussions and satisfy the pre-conditions to the announcement of a formal transaction, the board of SABMiller has requested that the Panel on Takeovers and Mergers further extends the relevant deadline until 5pm November 11, 2015.”
One major issue has been the potential impact of the takeover on the level of competition in the US market. AB InBev and SABMiller already have market shares of 46% and 27% respectively. SABMiller’s strong presence in this market is a result of its joint venture, MillerCoors, with Molson Coors. One reason behind the last request for an extension is to grant enough time for a deal to be finalised for the sale of SABMiller’s 58% stake in MillerCoors to Molson Coors. Without this sale the US competition authorities would not approve the takeover.
Most observers believe that it will take a year for the deal to be completed and it will be interesting to chart its progress over the next 12 months.
Postscript: AB InBev announced on 11th November that it had made a formal offer of £71 billion to acquire SABMiller and SABMiller’s share in MillerCoors had been sold to Molson Coors for $12 billion.
SABMiller to seek another Takeover Panel extension for AB InBev takeover The Telegraph, Ben Martin (04/11/15)
AB InBev and SABMiller allay concerns about 68bn MegaBrew deal The Telegraph, Ben Martin (28/10/15)
AB InBev, SABMiller extend takeover deadline to Nov.4 Reuters, Philip Blenkinsop (28/10/15)
SABMiller agrees AB Inbev takeover deal of £68bn The Guardian, Sean Farrell (13/10/15)
SABMiller is AB Inbev’s toughest takeover yet. It may not be its last The Economist (14/10/15)
Brewery Battle: AB Inbev and the Craft Beer Challenge BBC News, Peter Shadbolt (13/10/15)
Beer Giants AB Inbev and SABMiller Agree Takeover Terms BBC News (13/10/15)
Questions
- The proposed takeover of SABMiller by AB InBev would be the third largest in history. What are the two biggest deals?
- The European Commission investigates ‘large’ mergers that have an ‘EU dimension’. On what basis does the European Commission judge if a merger is large or has an EU dimension?
- On what basis are mergers judged by the Competition and Markets Authority in the UK?
- What is a ‘virtual bid’ period? How did the ‘pusu’ bid deadline operate before the changes were introduced in 2011?
- Pfizer’s bid for Astrazeneca did not succeed in May 2014. Some people blamed the collapse of the deal on the 28-day ‘pusu’ deadline and rule 2.5 (i) of the code. What is rule 2.5 (i) and how did it contribute towards the failure of this deal?


