Over the past three months oil prices have been falling. From the beginning of September to the end of November Brent Crude has fallen by 30.8%: from $101.2 to a four-year low of $70.0 per barrel (see chart below: click here for a PowerPoint). The fall in price has been the result of changes in demand and supply.
As the eurozone, Japan, South America and other parts of the world have struggled to recover, so the demand for oil has been depressed. But supply has continued to expand as the USA and Canada have increased shale oil production through fracking.  As far as OPEC is concerned, rather than cutting production, it decided at a meeting on 27 November to maintain the current target of 30 million barrels a day.
The videos and articles linked below look at these demand and supply factors and what is likely to happen to oil prices over the coming months.
They also look at the winners and losers. Although falling prices are likely in general to benefit oil importing countries and harm oil exporting ones, it is not as simple as that. The lower prices could help boost recovery and that could help to halt the oil price fall and be of benefit to the oil exporting countries. But if prices stay low for long enough, this could lower inflation and even cause deflation (in the sense of falling prices) in many countries. This, in turn, could dampen demand (see the blog post, Deflation danger). This is a particular problem in Japan and the eurozone. Major oil importing developing countries, such as China and India, however, should see a boost to growth from the lower oil prices.
Some oil exporting countries will be harder hit than others. Russia, in particular, has been badly affected, especially as it is also suffering from the economic sanctions imposed by Western governments in response to the situation in Ukraine. The rouble has fallen by some 32% this year against the US dollar and nearly 23% in the past three months alone.
Then there are the environmental effects. Cheaper oil puts less pressure on companies and governments to invest in renewable sources of energy. And then there are the direct effects on the environment of fracking itself – something increasingly being debated in the UK as well as in the USA and Canada.
Videos
 Oil price at four-year low as Opec meets BBC News, Mark Lobel (27/11/14)
Opec losing control of oil prices due to US fracking BBC News, Nigel Cassidy (4/12/13)
How the price of oil is set – video explainer The Telegraph, Oliver Duggan (28/11/14)
How Oil’s Price Plunge Impacts Wall Street Bloomberg TV, Richard Mallinson (28/11/14)
Oil Prices Plummet: The Impact on Russia’s Economy Bloomberg TV, Martin Lindstrom (28/11/14)
Articles
Oil prices plunge after Opec meeting BBC News (28/11/14)
Crude oil prices extend losses Financial Times, Dave Shellock (28/11/14)
Oil price plunges after Opec split keeps output steady The Guardian, Terry Macalister and Graeme Wearden (27/11/14)
Falling oil prices: Who are the winners and losers? BBC News, Tim Bowler (17/10/14)Hooray for cheap oil BBC News, Robert Peston (1/12/14)
Russian Recession Risk at Record as Oil Price Saps Economy Bloomberg, Andre Tartar and Anna Andrianova (28/11/14)
Rouble falls as oil price hits five-year low BBC News (1/12/14)
Data
Brent Spot Price US Energy Information Administration (select daily, weekly, monthly or annual: can be downloaded to Excel)
Spot exchange rate of Russian rouble against the dollar Bank of England
Questions
- Use a diagram to illustrate the effects of changes in the demand and supply of oil on oil prices.
- How does the price elasticity of demand and supply of oil affect the magnitude of these price changes?
- Explain whether (a) the demand for and (b) the supply of oil are likely to be relatively elastic or relatively inelastic? How are these elasticities likely to change over time?
- Distinguish between the spot price and forward prices of oil? If the three-month forward price is below the spot price, what are the implications of this?
- Analyse who gains and who loses from the recent price falls.
- What are the effects of a falling rouble on the Russian economy?
- What are likely to be the effects of further falls in oil prices on the eurozone economy?
 A big expenditure for many households is petrol. The price of petrol is affected by various factors, but the key determinant is what happens in the oil market. When oil prices rise, this pushes up the price of petrol at the pumps. But, when they fall, do petrol prices also fall? That is the question the government is asking.
The price of oil is a key cost of production for companies providing petrol and so when oil prices rise, it shifts the supply curve up to the left and hence prices begin to increase. We also see supply issues developing with political turmoil, fears of war and disruption and they have a similar effect. As such, it is unsurprising that petrol prices rise with concern of supply and rising costs. But, what happens when the opposite occurs? Oil prices have fallen significantly: by a quarter. Yet, prices at the pump have fallen by around 6%. This has caused anger amongst customers and the government is now urging petrol retailers to pass their cost savings from a lower price of oil onto customers. Danny Alexander, Chief Secretary to the Treasury said:
“I believe it’s called the rocket-and-feather effect. The public have a suspicion that when the price of oil rises, pump prices go up like a rocket. But when the price of oil falls, pump prices drift down like a feather … This has been investigated before and no conclusive evidence was found. But even if there were a suspicion it could be true this time it would be an outrage.”
However, critics suggest that tax policy is partly to blame as 63% of the cost of petrol is in the form taxation through fuel duty and VAT. Therefore even if oil prices do fall, the bulk of the price we pay at the pumps is made up of tax revenue for the government. Professor Stephen Glaister, director of the RAC Foundation said:
“It’s a simple story. Before tax we have just about the cheapest petrol and diesel in Europe. After tax we have just about the most expensive … It’s right to keep the pressure on fuel retailers but if drivers want to know what’s behind the high pump prices of recent years all they have to do is follow the trail back to the Treasury … if ministers are serious about reducing fuel prices further then they should cut duty further.”
 (Click here for a PowerPoint of the chart.)
However, even taking out the fuel duty and VAT, Arthur Renshaw, an analyst at Experian has said that the actual price of petrol has fallen by 21% since last year. Still, a much bigger decrease than we have seen at the pumps. One further reason for this may be the fact that dollars is the currency in which oil is traded. The pound has been relatively weak, falling by almost 7% over the past few months and hence even though the price of oil has fallen, the effect on UK consumers has been less pronounced.
The big supermarkets have responded to government calls to cut petrol prices, but how much of this cut was influenced by the government and how much was influenced by the actions of the other supermarkets is another story. A typical oligopoly, where interdependence is key, price wars are a constant feature, so even if one supermarket cut petrol prices, this would force others to respond in kind. If such price wars continue, further price cuts may emerge. Furthermore, with oil production still at such high levels, this market may continue to put downward pressure on petrol prices. Certainly good news for consumers – we now just have to wait to see how long it lasts, with key oil producing countries, such as Russia taking a big hit. The following articles consider this story.
Articles
Supermarkets cut fuel prices again The Telegraph, Nick Collins (6/11/14)
Petrol retailers urged to cut prices in line with falling oil costs The Guardian, Terry Macalister (6/11/14)
Supermarkets cut petrol prices after chancellor’s criticism Financial Times, Michael Kavanagh (6/11/14)
Governent ‘watching petrol firms’ Mail Online (6/11/14)
Our horrendous tax rates are the real reason why petrol is still so expensive The Telegraph, Allister Heath (6/11/14)
Osborne ‘expects’ fuel price drop after fall in oil price BBC News (6/11/14)
Danny Alexander tells fuel suppliers to pass on oil price cuts to drivers The Telegraph, Peter Dominiczak (5/11/14)
Further UK fuel cuts expected as pound strengthens The Scotsman, Alastair Dalton (6/11/14)
Data
Spot oil prices Energy Information Administration
Weekly European Brent Spot Price Energy Information Administration (Note: you can also select daily, monthly or annual.)
Annual Statistical Bulletin OPEC
Questions
- Using a supply and demand diagram, illustrate the impact that a fall in the price of oil should have on the price of petrol.
- What is the impact of a tax on petrol?
- Why is petrol a market that is so heavily taxed? You should think about the incidence of taxation in your answer.
- Why does the strength of the pound have an impact on petrol prices in the UK and how much of the oil price is passed onto customers at the pumps?
- Does the structure of the supermarket industry help customers when it comes to the price of petrol? Explain your answer.
- Militant action in some key oil producing countries has caused fears of oil disruption. Why is that oil prices don’t reflect these very big concerns?
 The housing market and what to do about bubbles, second homes and first time buyers is likely to be one of many battle grounds at the next election. For many years, the idea of a mansion tax has been debated and the Shadow Chancellor, Ed Balls, has outlined plans for a mansion tax under a Labour government.
The policy would see houses valued at between £2 and £3 million pay £250 a month as a mansion tax. Those owning a home worth tens of millions and those with second homes would pay more under the mansion tax, which would be based on a progressive system. Concerns have been raised about the impact of this tax on home-owners in areas like London, where average house prices are considerably higher than the UK average. Ed Balls has sought to reassure homeowners that payment of the mansion tax could be deferred if earnings do not reach the £42,000 threshold. However, critics have suggested that this policy will only make things worse for middle income households who will not be able to defer such a payment if their income is £43,000. Labour’s MP for Greenwich, Nick Raynsford said, ‘What it does is create a cliff edge. It will still hit people who are asset rich but cash poor.” Writing in the Evening Standard, Ed Balls said:
“Long-standing residents who now find themselves living in high-value homes but do not have an income high enough to pay the higher or top rate of income tax — in other words earn less than £42,000 a year — will be guaranteed the right to defer the charge until the property changes hands.
So a tax on the highest value properties will be done fairly and carefully to help fund our NHS for the future.
Ordinary Londoners should be protected and wealthy foreign investors must finally make a proper tax contribution in this country.”
Although similar in its objective to the Liberal Democrat’s mansion tax, the amount of the tax as a percentage of the value of the home under Labour is significantly lower. It is likely to be between 0.1% and 0.15% of the home’s valued, compared to the 1% levy proposed by the Liberal Democrats.
 One debate now surrounds the amount that this tax is expected to raise, especially given the revenue has been ear-marked to finance the NHS. The number of homes whose value is estimated to fall between £2m and £3m varies considerably and hence so would the revenues raised from such a tax. However, the income generated by even the most generous estimates will not come close to raising the ear-marked figure of £1.2bn. As such, there are suggestions that the tax levied on houses worth more than £3m; on foreign owners of residences in the UK and second homes will need to be significant to make up the short fall. A spokesperson for the Conservatives said:
“Serious questions have now been raised about how much revenue Labour would be able to raise from the tax …This is a further unravelling of the policy, which faced fierce criticism after it was revealed that no money would be raised until halfway through the next parliament, and the proposals for mass valuations of family homes was widely slammed as unworkable.”
The UK residential research director of Savills estate agency, Lucian Cook, added:
“Given Labour’s stated ambition to raise £1.2bn, that would leave at least £1.08bn to be raised from the remaining 57,000 properties, possibly more to account for tax leakage elsewhere in the system.”
The impact of the mansion tax will depend on exactly how it is imposed and the thresholds, together with how the threshold changes with the housing market. In the UK, we have seen some houses increase in value by huge amounts in just a few months and with a mansion tax, any such increase in price could move more home-owners into the new progressive tax system. Some argue that it is a tax on Londoners. The following articles consider the proposed policy by Labour.
Ed Balls seeks to reassure London home owners over mansion tax plans The Guardian, Patrick Wintour (20/10/14)
Ed Balls: Mansion tax would start at £250 a month BBC News (20/10/14)
‘Mansion tax’ will mean bill of £250 a month, says Ed Balls Financial Times, Emily Cadman, Kate Allen, Vanessa Houlder and George Parker (20/10/14)
Mansion tax can be deferred in you earn less than £42,000, Ed Balls insists as he reveals details of levy on £2million homes Mail Online, Matt Chorley (20/10/14)
Ed Balls: Mansion tax will cost homeowners £250 a month London Evening Standard (20/10/14)
Middle-class families hit by Labour’s mansion tax The Telegraph, Steven Swinford (20/10/14)
Balls says mansion-tax threshold to rise with home values Bloomberg, Svenja O’Donnell (20/10/14)
Questions
- How does a progressive tax system work?/li>
- Why are some critics arguing that this mansion tax would just be a tax on Londoners?
- What objective is the £42,000 income threshold trying to achieve? Do you think that critics are correct in their assertion that it penalises middle income households?
- Fiscal drag is mentioned in the BBC News article as a potential problem with the mansion tax proposed by Labour and that houses may move into the taxable threshold. What is fiscal drag and why is it a potential concern?
- How might such a policy affect the incentives of foreigners to invest in the UK housing market? Would this be a good or a bad thing and for who?
- The revenues generated from houses between £2 and £3m will not be sufficient to generate £1.2bn. What are the implications for how progressive the mansion tax would need to be and how this might affect homeowners?
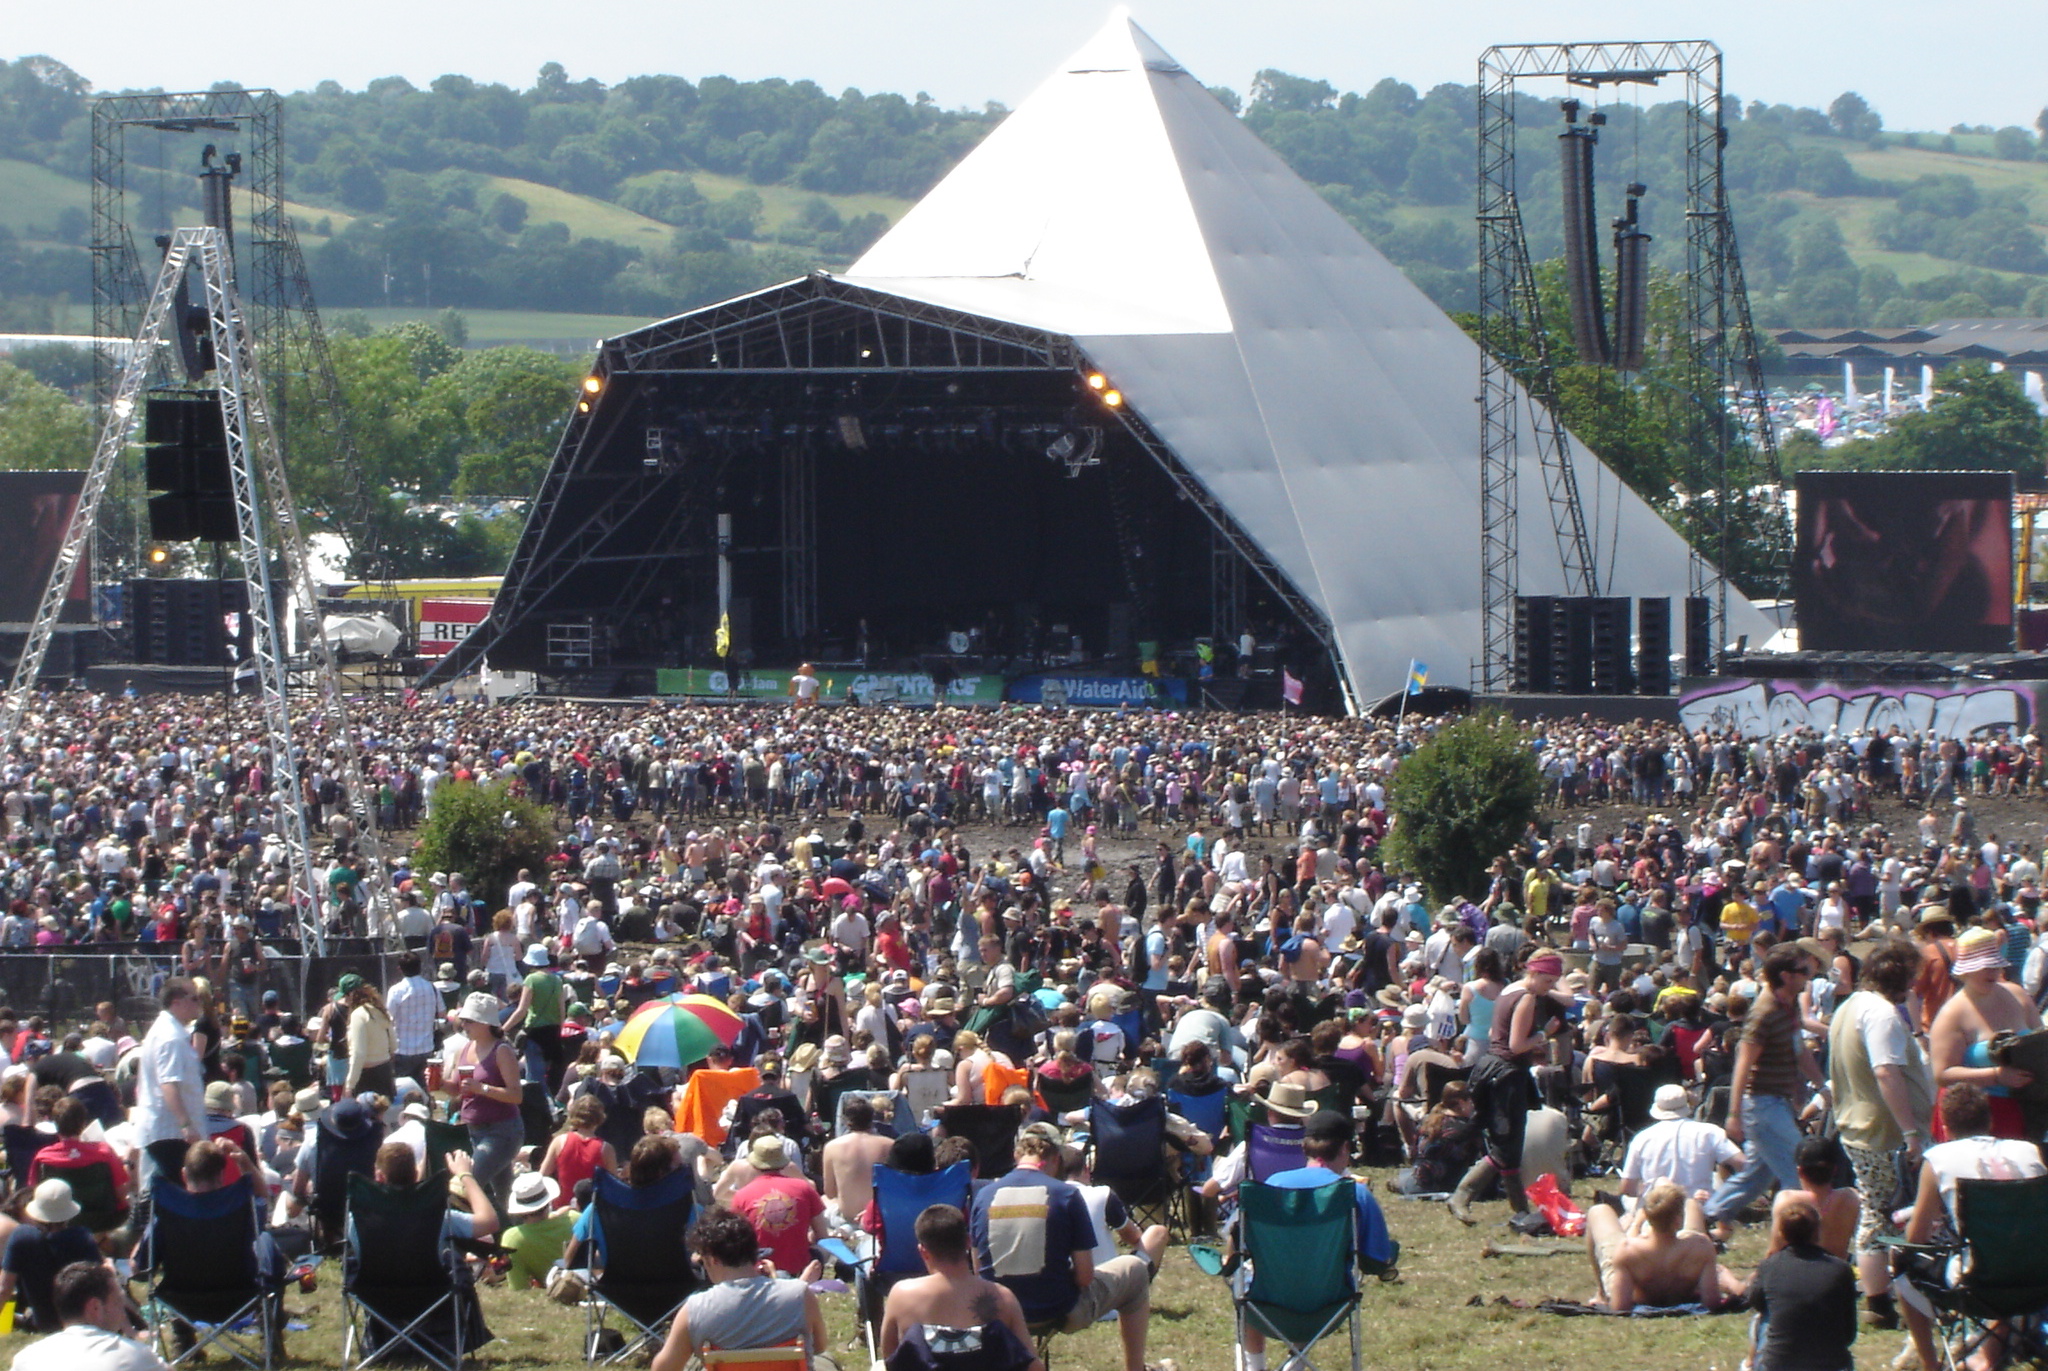
 An annual event takes place every October that leads to a large number of frustrated consumers – the sale of tickets for the Glastonbury festival. This year the sale of standard tickets began at 9.00am on Sunday 5th October. Within 27 minutes all of the 120,000 tickets had been sold and it was reported that over a million people had tried to access the website. Social media was full of messages from disappointed fans that had been unable to get a ticket.
The Glastonbury festival has grown in popularity and the organisers adopted a unique way of selling the tickets a number of years ago. They introduced a system that made it impossible for people to purchase tickets unless they had previously registered. Although there is no charge to register, in order to complete the process successfully, people have to submit a clear passport style photograph in Jpeg format. Once registered, customers are allocated a unique registration number which they must submit in order to purchase a ticket when they go on sale. Each buyer can purchase up to a maximum of 6 tickets and must provide a valid registration number for each separate ticket they obtain. Successful applicants receive a personalised ticket, including their photo, which cannot be re-sold. The organisers have been very clear about the rationale for introducing this scheme. They have stated that it is part of their
“on-going efforts to cut out ticket touting”
However a number of people have criticised the ticket sale process. These criticisms tend to fall into two key areas: first, the method used in the initial sale process and second, the constraints placed on resale after a ticket has been purchased.
The tickets are sold by the company SeeTickets and their Head of Business Development stated in an interview in 2013 that:
 There is something like 1,100,000 customers registered to go to Glastonbury, and they all want a ticket. It’s a shame but there is nothing you can do about it. The 900,000 people that don’t get to go often come up with the argument, why don’t you just have a ballot? Why don’t we just register and a computer generated ballot just picks the winners? I think they’ve (Glastonbury) always had a view that if you get a ticket to Glastonbury there’s an element of work that you have to do to achieve that and it does reward that commitment. I think there’s a sense that if you use a ballot then maybe you’d get some people who were not as committed.
However responding to these comments a customer commented that:
I’ve been lucky in the past and got tickets within minutes and like this year tried all morning and come away empty handed. Whether I have been successful has nothing to do with hard work but the vagaries of the internet and a bit of luck.
Another customer commented:
No ballot! It’s too random. People who really,really want to go should get the tickets, so the only fair way is regional ticket sales, where you could queue ( overnight if required) to get your ticket. This is the only fair way. Year after year genuine fans miss out. This way fans who are willing to make an effort get the chance, rather than a ballot or the random computer system which they have at present.
Others have criticised the limited ability consumers are given to resell their tickets. The full cost of a ticket for the 2015 festival is £220 plus a £5 booking fee. When the tickets are originally sold in October, the buyers have to pay a £50 deposit and at this point none of the bands playing at the festival have been announced. The remaining balance of £175 is due at the beginning of April by which point some of the bands/acts will have been confirmed. Anyone who decides not to pay the balance or cancel their order before this date is refunded their deposit, minus an administration fee. Those tickets are then put forward for re-sale. The re-sale process typically takes place at the end of April and once again is only open to people who have previously registered. Last year 10,000 tickets were re-sold in just 12 minutes! Once this period in April is over the re-sale of tickets is prohibited even though the complete line-up for the festival may not have been confirmed.
The secondary ticket company Viagogo reported the results from research they had carried out on the 2014 festival. This found that following the relatively late announcement of Metallica as one of the headline acts,78% of people who had bought a ticket said they would have resold it if they’d had the chance.
A spokesperson from Viagogo stated that:
We believe that once you’ve bought a ticket it’s yours and if you want to sell it or give it away, you should be allowed to do so. In this case, with an unpopular headline act announced late, ticket holders lose out because they can’t resell their tickets and Metallica fans lose out because they can’t buy them.
Those people who either did not get a ticket or are left with a ticket they would rather re-sell will no doubt continue to complain about the ticket selling process.
Articles
Questions
- What is the opportunity cost of going to the Glastonbury Festival? Discuss some of the non-ticket factors you have included in your calculations.
- Draw a demand and supply diagram to illustrate the market for Glastonbury tickets. NB think carefully about the shape of the supply curve in both the short-run and the long run. Is the current price of a ticket at the market clearing level? Explain your answer.
- The sale and re-sale of tickets takes place before the all the headline acts have been announced. Illustrate what will happen to the demand curve for consumers with different preferences once the headline acts have been announced.
- Assess the relative costs and benefits of using a ballot instead of the current system used by the festival organisers to sell of tickets.
- The organisers of the festival introduced the registration process in order to limit the re-sale of the tickets. Analyse the impact of this policy on Pareto and allocative efficiency? Will the policy cause any deadweight welfare loss? What factors will determine the size of any deadweight welfare loss?
- Suggest some reasons why care may need to be taken when using the results from the research carried out by Viagogo.
 The typical UK high street is changing. Some analysts have been arguing for some time that high streets are dying, with shops unable to face the competition from large supermarkets and out-of-town malls. But it’s not all bad news for the high street: while some types of shop are disappearing, others are growing in number.
Part of the reason for this is the rise in online shopping; part is the longer-term effects of the recession. One consequence of this has been a shift in demand from large supermarkets (see the blog, Supermarket wars: a pricing race to the bottom). Many people are using local shops more, especially the deep discounters, but also the convenience stores of the big supermarket chains, such as Tesco Express and Sainsbury’s Local. Increasingly such stores are opening in shops and pubs that have closed down. As The Guardian article states:
The major supermarket chains are racing to open high street outlets as shoppers move away from the big weekly trek to out-of-town supermarkets to buying little, local and often.

Some types of shop are disappearing, such as video rental stores, photographic stores and travel agents. But other types of businesses are on the increase. In addition to convenience stores, these include cafés, coffee shops, bars, restaurants and takeaways; betting shops, gyms, hairdressers, phone shops and tattoo parlours. It seems that people are increasingly seeing their high streets as social places.
Then, reflecting the widening gap between rich and poor and the general desire of people to make their money go further, there has been a phenomenal rise in charity shops and discount stores, such as Poundland and Poundworld.

So what is the explanation? Part of it is a change in tastes and fashions, often reflecting changes in technology, such as the rise in the Internet, digital media, digital photography and smart phones. Part of it is a reflection of changes in incomes and income distribution. Part of it is a rise in highly competitive businesses, which challenge the previous incumbents.
But despite the health of some high streets, many others continue to struggle and the total number of high street stores across the UK is still declining.
What is clear is that the high street is likely to see many more changes. Some may die altogether, but others are likely to thrive if new businesses are sufficiently attracted to them or existing ones adapt to the changing market.
How the rise of tattoo parlours shows changing face of Britain’s high streets The Guardian, Zoe Wood and Sarah Butler (7/10/14)
The changing face of the British High Street: Tattoo parlours and convenience stores up, but video rental shops and travel agents down Mail Online, Dan Bloom (8/10/14)
High Street footfall struggles in August Fresh Business Thinking, Jonathan Davies (15/9/14)
Ghost town Britain: Internet shopping boom sees 16 high street stores close every day Mail Online, Sean Poulter (8/10/14)
Questions
- Which of the types of high street store are likely to have a high income elasticity of demand? How will this affect their future?
- What factors other than the types of shops and other businesses affect the viability of high streets?
- What advice would you give your local council if it was keen for high streets in its area to thrive?
- Why are many large superstores suffering a decline in sales? Are these causes likely to be temporary or long term?
- How are technological developments affecting high street sales?
- What significant changes in tastes/fashions are affecting the high street?
- Are you optimistic or pessimistic about the future of high streets? Explain.
 Over the past three months oil prices have been falling. From the beginning of September to the end of November Brent Crude has fallen by 30.8%: from $101.2 to a four-year low of $70.0 per barrel (see chart below: click here for a PowerPoint). The fall in price has been the result of changes in demand and supply.
  Major oil importing developing countries, such as China and India, however, should see a boost to growth from the lower oil prices.