Back in October, we examined the rise in oil prices. We said that, ‘With Brent crude currently at around $85 per barrel, some commentators are predicting the price could reach $100. At the beginning of the year, the price was $67 per barrel; in June last year it was $44. In January 2016, it reached a low of $26.’ In that blog we looked at the causes on both the demand and supply sides of the oil market. On the demand side, the world economy had been growing relatively strongly. On the supply side there had been increasing constraints, such as sanctions on Iran, the turmoil in Venezuela and the failure of shale oil output to expand as much as had been anticipated.
But what a difference a few weeks can make!
Brent crude prices have fallen from $86 per barrel in early October to just over $50 by the end of the year – a fall of 41 per cent. (Click here for a PowerPoint of the chart.) Explanations can again be found on both the demand and supply sides.
On the demand side, global growth is falling and there is concern about a possible recession (see the blog: Is the USA heading for recession?). The Bloomberg article below reports that all three main agencies concerned with the oil market – the U.S. Energy Information Administration, the Paris-based International Energy Agency and OPEC – have trimmed their oil demand growth forecasts for 2019. With lower expected demand, oil companies are beginning to run down stocks and thus require to purchase less crude oil. Fracking (Source: US Bureau of Land Management Environmental Assessment, public domain image)
On the supply side, US shale output has grown rapidly in recent weeks and US output has now reached a record level of 11.7 million barrels per day (mbpd), up from 10.0 mbpd in January 2018, 8.8 mbpd in January 2017 and 5.4 mbpd in January 2010. The USA is now the world’s biggest oil producer, with Russia producing around 11.4 mpbd and Saudi Arabia around 11.1 mpbd.
Total world supply by the end of 2018 of around 102 mbpd is some 2.5 mbpd higher than expected at the beginning of 2018 and around 0.5 mbpd greater than consumption at current prices (the remainder going into storage).
So will oil prices continue to fall? Most analysts expect them to rise somewhat in the near future. Markets may have overcorrected to the gloomy news about global growth. On the supply side, global oil production fell in December by 0.53 mbpd. In addition OPEC and Russia have signed an accord to reduce their joint production by 1.2 mbpd starting this month (January). What is more, US sanctions on Iran have continued to curb its oil exports.
But whatever happens to global growth and oil production, the future price will continue to reflect demand and supply. The difficulty for forecasters is in predicting just what the levels of demand and supply will be in these uncertain times.
So here we are, summer is over (or almost over if you’re an optimist) and we are sitting in front of our screens reminiscing about hot sunny days (at least I do)! There is no doubt, however: a lot happened in the world of politics and economics in the past three months. The escalation of the US-China trade war, the run on the Turkish lira, the (successful?) conclusion of the Greek bailout – these are all examples of major economic developments that took place during the summer months, and which we will be sure to discuss in some detail in future blogs. Today, however, I will introduce a topic that I am very interested in as a researcher: the liberalisation of energy markets in developing countries and, in particular, Mexico.
Why Mexico? Well, because it is a great example of a large developing economy that has been attempting to liberalise its energy market and reverse price setting and monopolistic practices that go back several decades. Until very recently, the price of petrol in Mexico was set and controlled by Pemex, a state monopolist. This put Pemex under pressure since, as a sole operator, it was responsible for balancing growing demand and costs, even to the detriment of its own finances.
The petrol (or ‘gasoline’) price liberalisation started in May 2017 and took place in stages – starting in the North part of Mexico and ending in November of the same year in the central and southern regions of the country. The main objective was to address the notable decrease in domestic oil production that put at risk the ability of the country to meet demand; as well as Mexico’s increasing dependency on foreign markets affected by the surge of the international oil price. The government has spent the past five years trying to create a stronger regulatory framework, while easing the financial burden on the state and halting the decline in oil reserves and production. Unsurprisingly, opening up a monopolistic market turns out to be a complex and bumpy process.
Source: Author’s calculations using data from the Energy Information Bank, Ministry of Energy, Mexico
Despite all the reforms, retail petrol prices have kept rising. Although part of this price rise is demand-driven, an increasing number of researchers highlight the significance of the distribution of oil-related infrastructure in determining price outcomes at the federal and regional (state) level. Saturation and scarcity of both distribution and storage infrastructure are probably the two most significant impediments to opening the sector up to competition (Mexico Institute, 2018). You see, the original design of these networks and the deployment of the infrastructure was not aimed at maximising efficiency of distribution – the price was set by the monopolist and, in a way that was compliant with government policy (Mexico Institute, 2018). Economic efficiency was not always part of this equation. As a result, consumers located in better-deployed areas were subsidising the inherent logistics costs of less ‘well endowed’ regions by facing an artificially higher price than they would have in a competitive market.
But what about now? Do such differences in the allocation of infrastructure between regions lead to location-related differences in the price of petrol? If so, by how much? And, what policies should the government pursue to address such imbalances? These are all questions that I explore in one of my recent working papers titled ‘Widening the Gap: Lessons from the aftermath of the energy market reform in Mexico’ (with Hugo Vallarta) and I will be sharing some of the answers with you in a future blog.
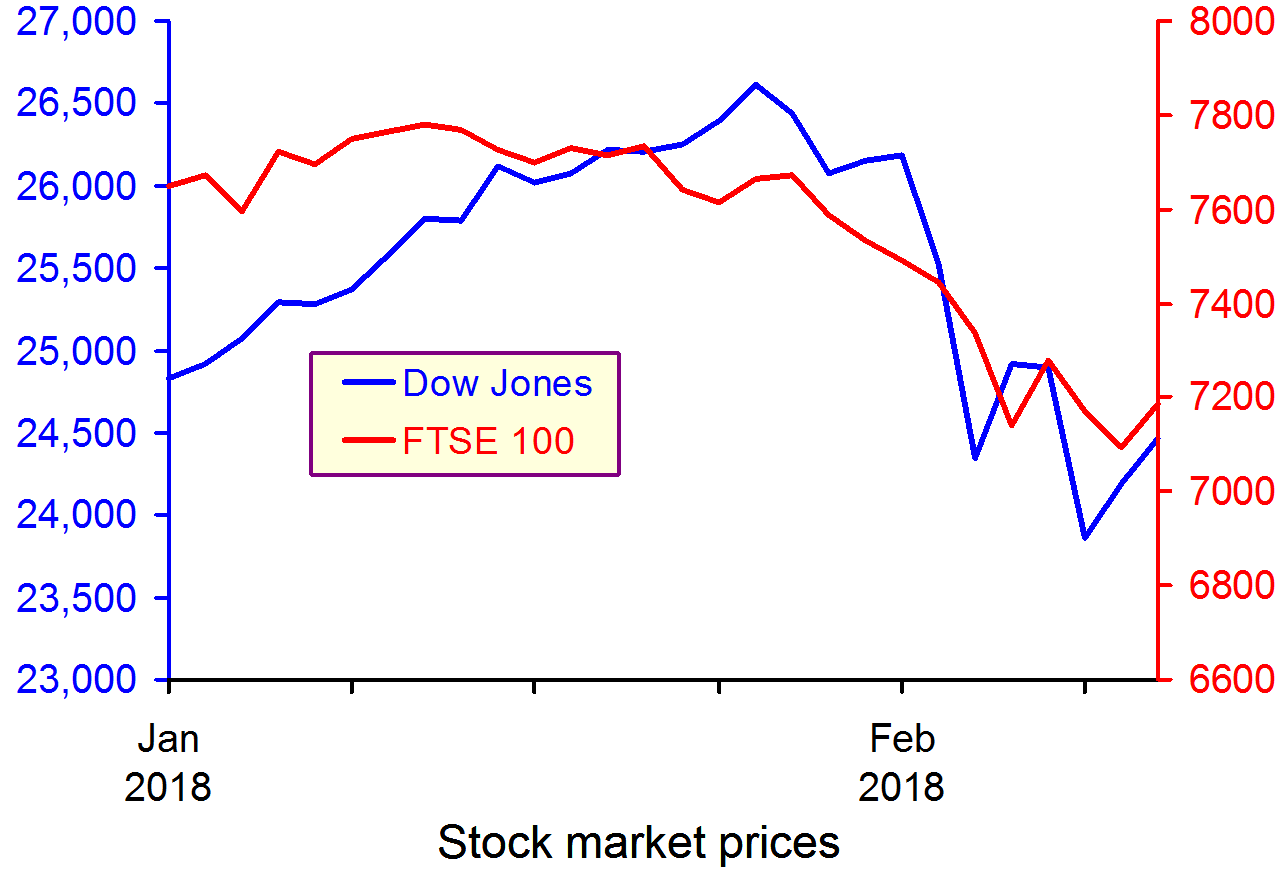
On 8 February, the Bank of England issued a statement that was seen by many as a warning for earlier and speedier than previously anticipated increases in the UK base rate. Mark Carney, the governor of the Bank of England, referred in his statement to ‘recent forecasts’ which make it more likely that ‘monetary policy would need to be tightened somewhat earlier and by a somewhat greater extent over the forecast period than anticipated at the time of the November report’.
A similar picture emerges on the other side of the Atlantic. With labour markets continuing to deliver spectacularly high rates of employment (the highest in the last 17 years), there are also now signs that wages are on an upward trajectory. According to a recent report from the US Bureau of Labor Statistics, US wage growth has been stronger than expected, with average hourly earnings rising by 2.9 percent – the strongest growth since 2009.
These statements have coincided with a week of sharp corrections and turbulence in the world’s largest capital markets, as investors become increasingly conscious of the threat of rising inflation – and the possibility of tighter monetary policy.
The Dow Jones plunged from an all-time high of 26,186 points on 1 February to 23,860 a week later – losing more than 10 per cent of its value in just five trading sessions (suffering a 4.62 percentag fall on 5 February alone – the worst one-day point fall since 2011). European and Asian markets followed suit, with the FTSE-100, DAX and NIKKEI all suffering heavy losses in excess of 5 per cent over the same period.
But why should higher inflationary expectations fuel a sell-off in global capital markets? After all, what firm wouldn’t like to sell its commodities at a higher price? Well, that’s not entirely true. Investors know that further increases in inflation are likely to be met by central banks hiking interest rates. This is because central banks are unlikely to be willing or able to allow inflation rates to rise much above their target levels.
The Bank of England, for instance, sets itself an inflation target of 2%. The actual ongoing rate of inflation reported in the latest quarterly Inflation Report is 3% (50 per cent higher than the target rate).
Any increase in interest rates is likely to have a direct impact on both the demand and the supply side of the economy.
Consumers (the demand side) would see their cost of borrowing increase. This could put pressure on households that have accumulated large amounts of debt since the beginning of the recession and could result in lower consumer spending.
Firms (the supply side) are just as likely to suffer higher borrowing costs, but also higher operational costs due to rising wages – both of which could put pressure on profit margins.
It now seems more likely that we are coming towards the end of the post-2008 era – a period that saw the cost of money being driven down to unprecedentedly low rates as the world’s largest economies dealt with the aftermath of the Great Recession.
For some, this is not all bad news – as it takes us a step closer towards a more historically ‘normal’ equilibrium. It remains to be seen how smooth such a transition will be and to what extent the high-leveraged world economy will manage to keep its current pace, despite the increasingly hawkish stance in monetary policy by the world’s biggest central banks.
Using supply and demand diagrams, explain the likely effect of an increase in interest rates to equilibrium prices and output. Is it good news for investors and how do you expect them to react to such hikes? What other factors are likely to influence the direction of the effect?
Do you believe that the current ultra-low interest rates could stay with us for much longer? Explain your reasoning.
What is likely to happen to the exchange rate of the pound against the US dollar, if the Bank of England increases interest rates first?
Why do stock markets often ‘overshoot’ in responding to expected changes in interest rates or other economic variables
OPEC, for some time, was struggling to control oil prices. Faced with competition from the fracking of shale oil in the USA, from oil sands in Canada and from deep water and conventional production by non-OPEC producers, its market power had diminished. OPEC now accounts for only around 40% of world oil production. How could a ‘cartel’ operate under such conditions?
One solution was attempted in 2014 and 2015. Faced with plunging oil prices which resulted largely from the huge increase in the supply of shale oil, OPEC refused to cut its output and even increased it slightly. The aim was to keep prices low and to drive down investment in alternative sources, especially in shale oil wells, many of which would not be profitable in the long term at such prices.
In late 2016, OPEC changed tack. It introduced its first cut in production since 2008. In September it introduced a new quota for its members that would cut OPEC production by 1.2 million barrels per day. At the time, Brent crude oil price was around $46 per barrel.
In December 2016, it also negotiated an agreement with non-OPEC producers, and most significantly Russia, that they would also cut production, giving a total cut of 1.8 million barrels per day. This amounted to around 2% of global production. In March 2017, it was agreed to extend the cuts for the rest of the year and in November 2017 it was agreed to extend them until the end of 2018.
With stronger global economic growth in 2017 and into 2018 resulting in a growth in demand for oil, and with OPEC and Russia cutting back production, oil prices rose rapidly again (see chart: click here for a PowerPoint). By January 2018, the Brent crude price had risen to around $70 per barrel.
Low oil prices had had the effect of cutting investment in shale oil wells and other sources and reducing production from those existing ones which were now unprofitable. The question being asked today is to what extent oil production from the USA, Canada, the North Sea, etc. will increase now that oil is trading at around $70 per barrel – a price, if sustained, that would make investment in many shale and other sources profitable again, especially as costs of extracting shale oil is falling as fracking technology improves. US production since mid-2016 has already risen by 16% to nearly 10 million barrels per day. Costs are also falling for oil sand and deep water extraction.
In late January 2018, Saudi Arabia claimed that co-operation between oil producers to limit production would continue beyond 2018. Shale oil producers in the USA are likely to be cheered by this news – unless, that is, Saudi Arabia and the other OPEC and non-OPEC countries party to the agreement change their minds.
Using supply and demand diagrams, illustrate what has happened to oil prices and production over the past five years. What assumptions have you made about the price elasticity of supply and demand in your analysis?
If the oil price is above the level at which it is profitable to invest in new shale oil wells, would it be in the long-term interests of shale oil companies to make such investments?
Is the structure of the oil industry likely to result in long-term cycles in oil prices? Explain why or why not.
Investigate the level of output from, and investment in, shale oil wells over the past three years. Explain what has happened.
Would it be in the interests of US producers to make an agreement with OPEC on production quotas? What would prevent them from doing so?
What is likely to happen to oil prices over the coming 12 months? What assumptions have you made and how have they affected your answer?
If the short-term marginal costs of operating shale oil wells is relatively low (say, below $35 per barrel) but the long-term marginal cost (taking into account the costs of investing in new wells) is relatively high (say, over $65 per barrel) and if the life of a well is, say, 5 years, how is this likely to affect the pattern of prices and output over a ten-year period? What assumptions have you made and how do they affect your answer?
If oil production from countries not party to the agreement between OPEC and non-OPEC members increases rapidly and if, as a result, oil prices start to fall again, what would it be in OPEC’s best interests to do?
Each year for the past 60 years, the ONS has published ‘Family Spending’, which ‘gives an insight into the spending habits of UK households, broken down by household characteristics and types of spending’. The latest issue, covering the financial year ending 2017, has just been released.
To mark the 60th anniversary, the ONS has also published a blog, Celebrating 60 years of Family Spending, which compares spending patterns in 2017 with those in 1957. The blog looks at the percentage of the family budget spent on various categories, such as food, clothing, housing, tobacco and alcohol. Some of the percentages have changed dramatically over the years; others have hardly changed at all.
Before you read on, of the six categories mentioned above, which do you think have increased, which fallen and which stayed the same? What is your reasoning?
Differences in patterns of consumption partly reflect incomes. In 1957, real household income was £381 in today’s prices; today it’s £544 (43% more). You would expect, therefore, that a greater proportion of household incomes today would be spent on more luxurious goods, with a higher income elasticity of demand.
Other changes in consumption patterns reflect changes in tastes and attitudes. Thus there has been a huge fall in the proportion of household income spent on tobacco – down from 6% in 1957 to 1% in 2017.
Three of the biggest changes over the 60 years have been in housing costs, food and clothing. Housing costs (rent, mortgage interest, council tax, maintenance and home repairs) have doubled from around 9% to around 18% (although they were around 20% before the huge fall in interest rates following the financial crisis of 2007–8). Expenditure on food, by contrast, has fallen – from around 33% to around 16%. Expenditure on clothing has also fallen, from around 10% to around 5%.
Expenditure on alcohol, on the other hand, having risen somewhat in the 1970s and 80s, is roughly the same today as it was 60 years ago, at around 3% of household expenditure.
Some of the explanations for these changing patterns can be found on the supply side – changing costs of production, new technologies and competition; others can be found on the demand side – changes in tastes and changes in incomes. Some goods and services which we use today, such as computers, mobile phones, many other electrical goods, high-tech gyms and social media were simply not available 60 years ago.
Why has expenditure on housing increased so much as a proportion of household expenditure? What underlying factors help to explain this?
Why has expenditure on food fallen as a proportion of household expenditure? Are the explanations on both the demand and supply sides?
What has happened to the proportion of expenditure going on leisure goods and services? Explain.
What factors affect the proportion of expenditure going on motoring?
Of the broad categories of expenditure considered in this blog, which would you expect to increase, which to decrease and which to stay roughly the same over the coming 10 years? Why?
If expenditure on a particualar good falls as a percentage of total expenditure as income rises, does this make it an inferior good? Explain.
 Back in October, we examined the rise in oil prices. We said that, ‘With Brent crude currently at around $85 per barrel, some commentators are predicting the price could reach $100. At the beginning of the year, the price was $67 per barrel; in June last year it was $44. In January 2016, it reached a low of $26.’ In that blog we looked at the causes on both the demand and supply sides of the oil market. On the demand side, the world economy had been growing relatively strongly. On the supply side there had been increasing constraints, such as sanctions on Iran, the turmoil in Venezuela and the failure of shale oil output to expand as much as had been anticipated.
 Brent crude prices have fallen from $86 per barrel in early October to just over $50 by the end of the year – a fall of 41 per cent. (Click here for a PowerPoint of the chart.) Explanations can again be found on both the demand and supply sides.
 Oil prices decline on swelling oversupply, volatile markets
 So here we are, summer is over (or almost over if you’re an optimist) and we are sitting in front of our screens reminiscing about hot sunny days (at least I do)! There is no doubt, however: a lot happened in the world of politics and economics in the past three months. The escalation of the US-China trade war, the run on the Turkish lira, the (successful?) conclusion of the Greek bailout – these are all examples of major economic developments that took place during the summer months, and which we will be sure to discuss in some detail in future blogs. Today, however, I will introduce a topic that I am very interested in as a researcher: the liberalisation of energy markets in developing countries and, in particular, Mexico.
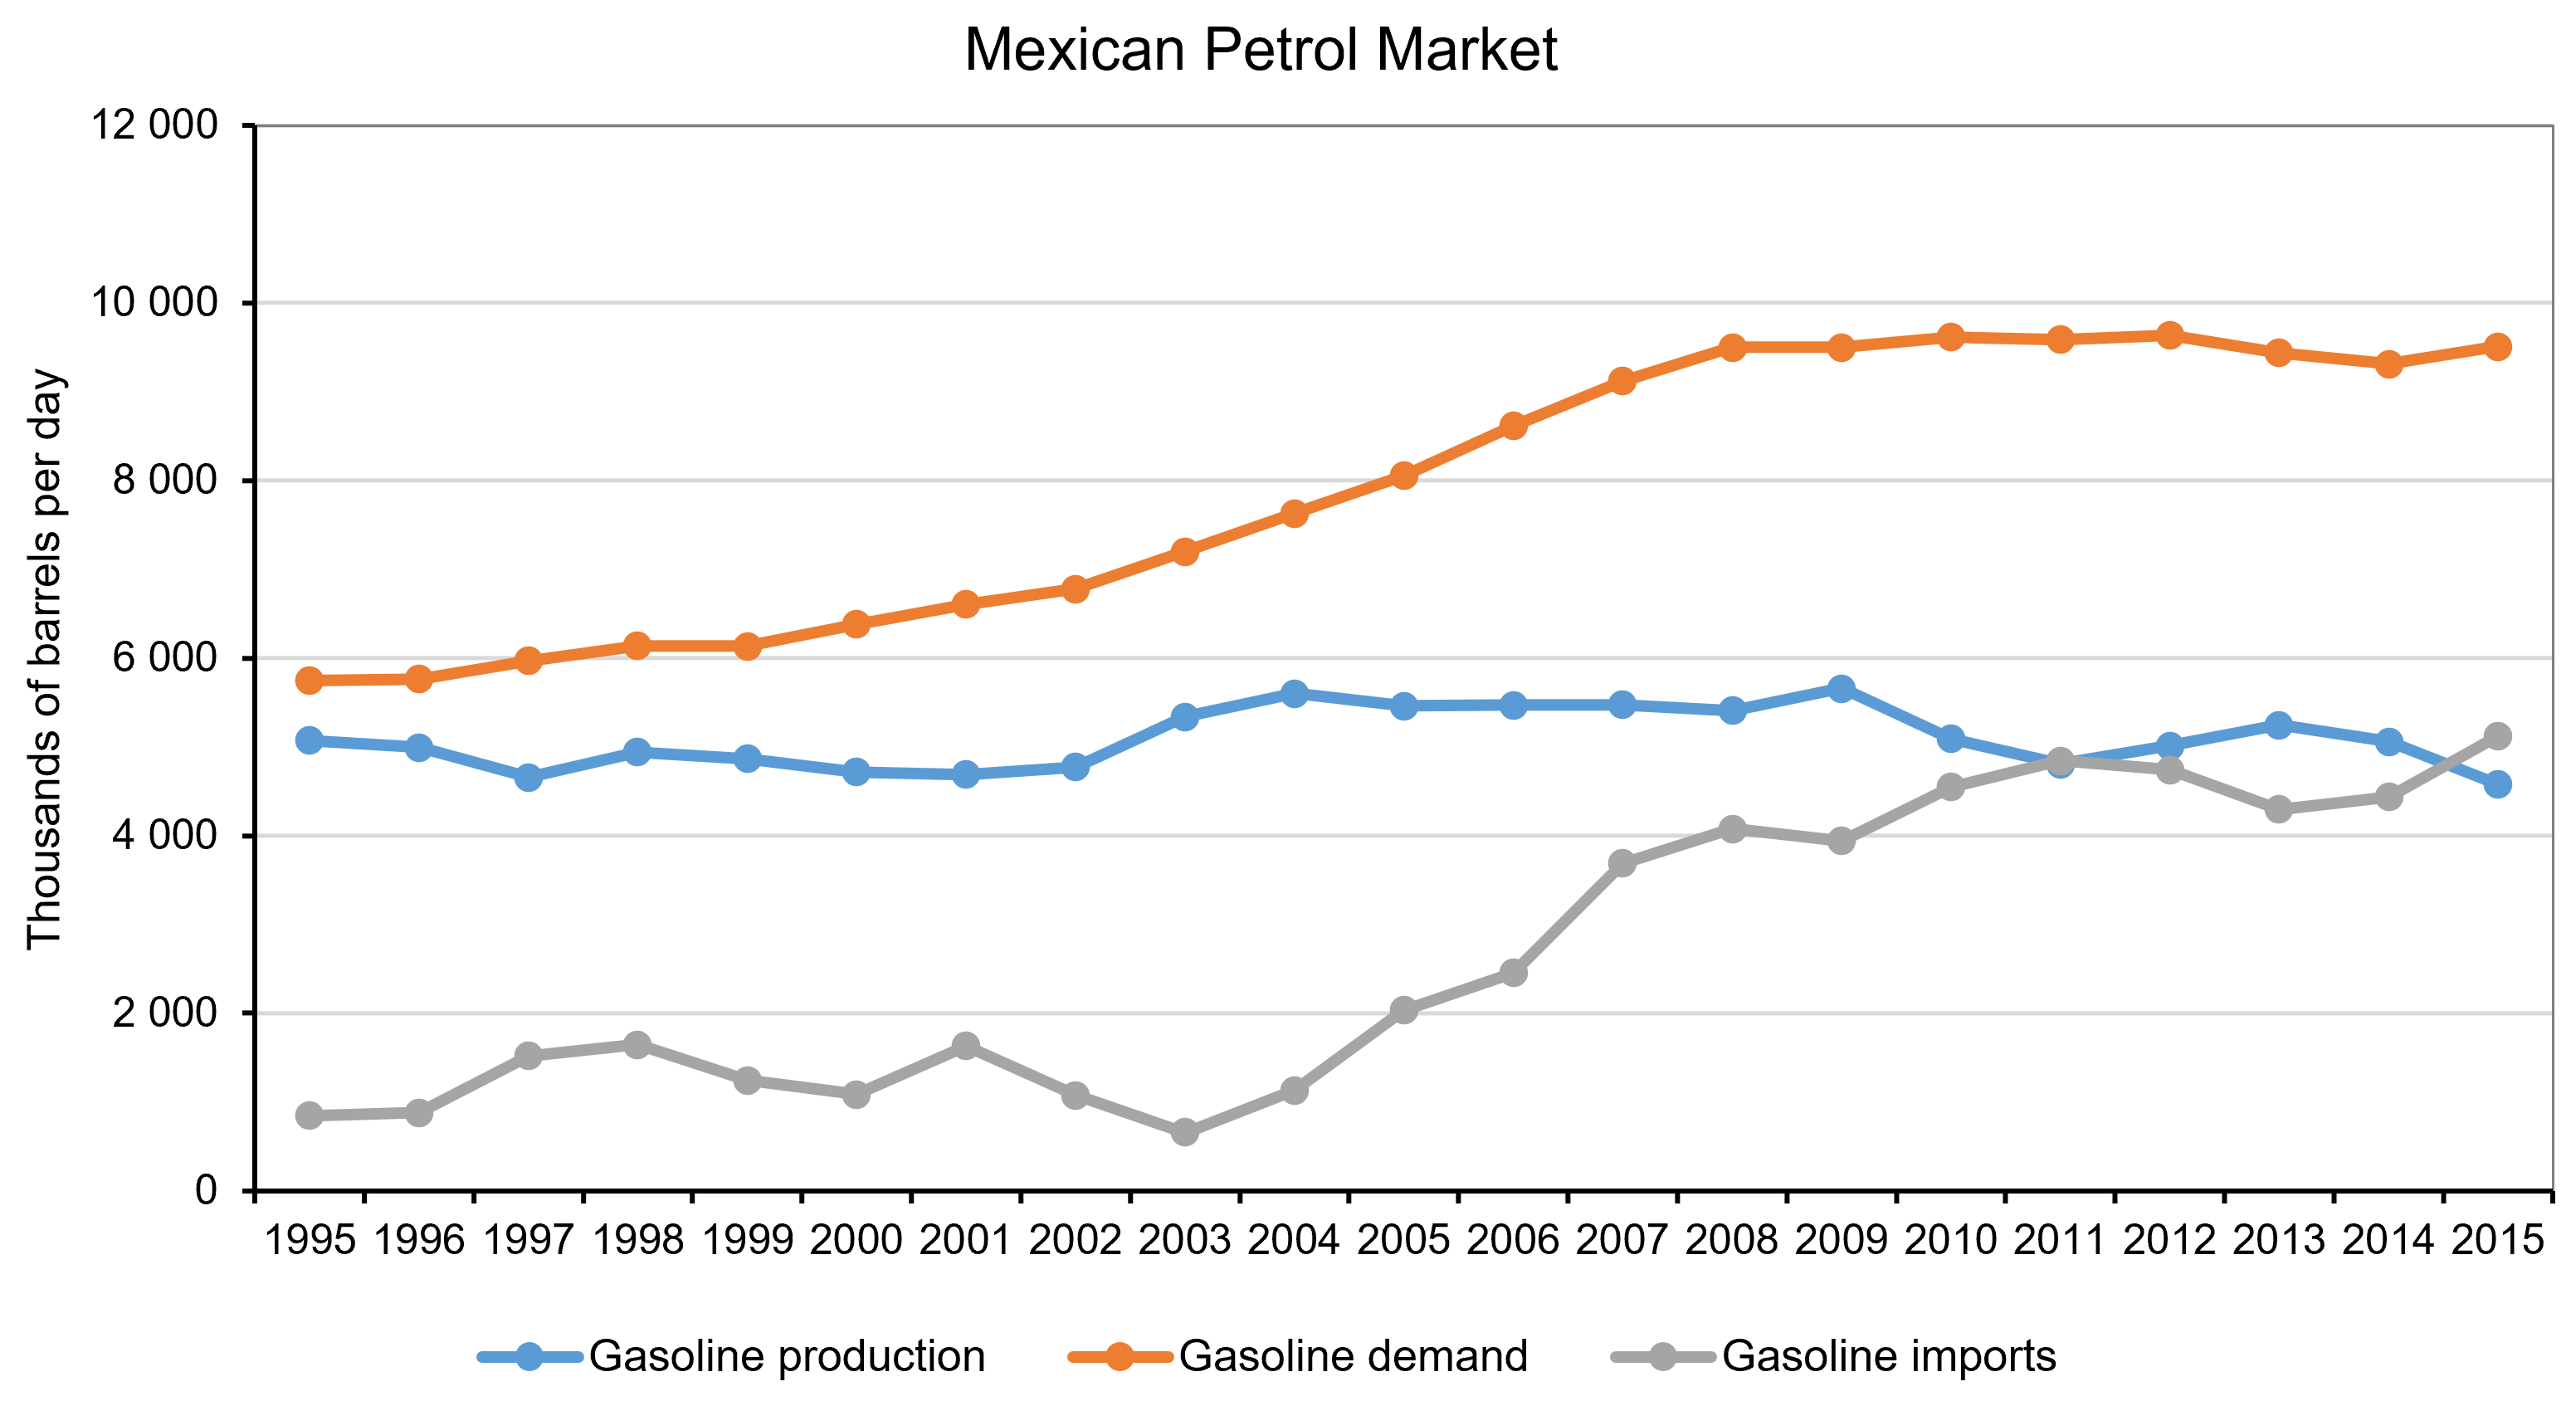 Source: Author’s calculations using data from the Energy Information Bank, Ministry of Energy, Mexico