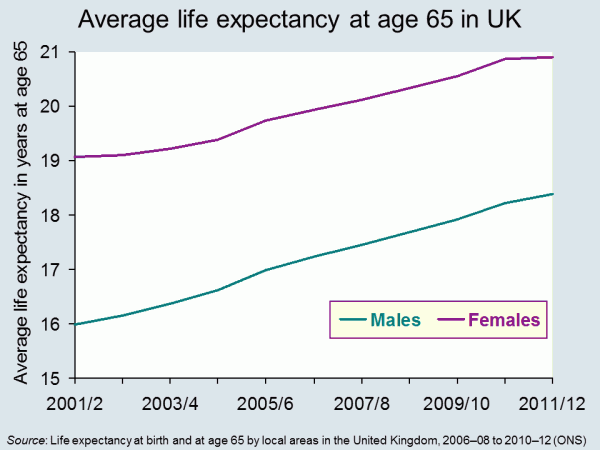
 Life expectancy is increasing across the world and the latest set of figures from the Office for National Statistics show that in the UK it has passed 79 for boys born in 2010–12, and 82 for girls born then. In fact the prediction is that over a third of babies born in 2013 will live to more than 100. The data throws up some interesting questions. How well prepared are we for lives that last this long? And how evenly distributed is this increase in life expectancy? Pensions’ minister, Steve Webb, has called for better information on life expectancy to be shared. How would this impact on our decision making?
It seems reasonable to think that increasing life expectancy must be good news. And of course, for individuals it can be. In 1951 the average man retiring at 65, in England and Wales, could expect to live and draw a pension for another 12.1 years. By 2014 this had risen to 22 years.
 But while we can look forward to longer life, for the government, it presents some challenges The first is that we just don’t save enough for our old age. This seems to be partly because we find it hard to make decisions that will have an impact so far in the future. There are a number of measures that have been put in place to encourage us to save more, including auto-enrolment into company pension schemes. This is being rolled out across businesses over the next three years. In the 2014 Budget, the Chancellor announced that people reaching retirement age will be able to draw all their pension as a cash lump sum, rather than having to take it as a regular income.
Another concern for government is the variations that we find in life expectancy across the UK. The 2014 ONS data identified that life expectancy for men born in Glasgow in 2012 is 72.6, in East Dorset it is 82.9. 25% of those in Glasgow are not expected to live to 65. The gap in years of good health is even greater. This presents governments with a long-term problem. How do they achieve greater equality in this instance? Do they focus resources on the areas that need it most? Do they legislate to address behaviour? Or do they rely on the provision of good advice – on diet, exercise and other factors?
Information has a role to play in both areas identified above. In April 2014, Steve Webb, suggested that in order to make good decisions at the point of retirement, people need to understand more about what lies ahead. He said:
People tend to underestimate how long they’re likely to live, so we’re talking about averages, something very broad-brush. Based on your gender, based on your age, perhaps asking one or two basic questions, like whether you’ve smoked or not, you can tell somebody that they might, on average, live for another 20 years or so.
This suggestion has led to some concerns being expressed at what appears to be an over-simplistic approach. Estimates can only be based on a mix of averages modified by individual information. Would the projections be shared with pension providers? What would you do if you exceeded your forecast life expectancy – by a long way – and had spent all your money? Could you sue someone?
Will your pension pot last as long as you will? The Telegraph, Dan Hyde and Richard Dyson (23/4/2014)
Scientists invent death test that will tell us how long we have to live Metro (11/8/13)
Games host Glasgow has worst life expectancy in the UK The Guardian, Caroline Davies (16/4/2014)
Pensioners could get life expectancy guidance BBC News Politics (17/4/14)
ONS reveals gaps in life expectancy across the UK FT Adviser Pensions, Kevin White (23/4/14)
Health care aid for developing countries boosts life expectancy Health Canal, Ruth Ann Richter (22/4/14)
A third of babies born this year will live to 100 This is Money.co.uk, Adam Uren (11/12/13)
Questions
- Thinking about the UK, what are the factors that might explain variations in life expectancy across different regions? How might the government address these differences? Why would they want to do so?
- Do the same factors explain variations between countries? Who can address these differences? Who would want to do so?
- If you could have a reasonable prediction of your life expectancy at 65, would you want it? How would your behaviour change if you were predicted a longer than average life expectancy? How would it change if you were predicted a shorter than average life expectancy?
- If you could have an accurate prediction of your life expectancy at 18, how would your answers differ? If this were possible, would it present any problems?
 Footballers in the English Premier League are some of the most highly paid workers in the world. With unique talents and skills and hence a limited supply of labour, together with an insatiable appetite from the British public for football, we would expect to see high wages and a market ripe for investment, with high returns on offer. But, is this case?
The article below is by Linda Yueh, the Chief Business Correspondent for BBC News, and she has looked into the football, asking why on earth buy a football club? Despite the success of the English Premier League in drawing fans, TV and commercial revenues, many teams find it difficult to break even and investing in a team is unlikely to yield much of a return (if any!). Yet, we still see successful businesspeople, especially from abroad, purchasing English football teams.
Many club owners have hugely profitable ventures in other markets and historically only invest their money when they see an opportunity for a high return. But, not in the case of football. A return is unlikely and yet they still invest. So, with positive returns unlikely, what is it about this market that attracts investors? The article by Linda Yueh considers this question.
Article
Why on earth buy a football club? BBC News, Linda Yueh (27/2/14)
Report
Annual Review of Football Finance – Highlights Deloitte, Sports Business Group June 2013
Questions
- How can the returns to investment be measured?
- How can a company’s operating profit be calculated?
- Using a labour market diagram, explain why footballers are paid such a high wage.
- Is it monetary or non-monetary factors that seem to explain why businessmen invest in football clubs?
- Why are English football clubs typically unprofitable? Should they be?
- Which factors can explain the growing financial inequality between clubs in the Premier League and in the divisions below? Is there an argument for government involvement to regulate football?
 In the blog Effects of raising the minimum
wage, the policy of an above-inflation rise in the minimum wage was discussed, as this had been advocated by political leaders. Over the past 5 years, the minimum wage has fallen in real terms, but from October 2014, the national minimum wage will increase 19p per hour and this rise will be the first time since 2008 when the increase will be higher than inflation.
The National Minimum Wage is a rate applied to most workers in the UK and is their minimum hourly entitlement. For adults over the age of 21, it will be increased by just over 3% to £6.50. Rises will also occur for 18-20 year olds, though their increase will be lower at 10p and will take the hourly wage to £5.13 an hour, representing a 2% rise.  Those aged 16 and 17 will also see a 2% rise, taking their wage up by 7p to £3.79. With inflation currently at 1.9% (as measured by the CPI), these rises outstrip inflation, representing a real increase in the minimum wage. Undoubtedly this is good news for workers receiving the minimum wage, and it is thought that millions of workers will benefit.
Vince Cable said:
The recommendations I have accepted today mean that low-paid workers will enjoy the biggest cash increase in their take home pay since 2008…This will benefit over one million workers on national minimum wage and marks the start of a welcome new phase in minimum wage policy.
While this rise has been praised, there are still suggestions that this minimum wage is too low and does not represent a ‘living wage’. The General Secretary of Unison said:
Across the country people are struggling to make ends meet. The sooner we move to a Living Wage the better. The real winners today will again be payday loan sharks who prey on working people, unable to bridge the financial gap between what they earn and what their families need to survive.

(Click here for a PowerPoint of the above chart.)
The Chancellor eventually wants to increase the minimum wage to £7 per hour, but there will undoubtedly be an impact on businesses of such a rise. Is it also possible that with the national minimum wage being pushed up, unemployment may become a problem once more?
Market wages are determined by the interaction of the demand and supply of labour and when they are in equilibrium, the only unemployment in the economy will be equilibrium unemployment, namely frictional or structural. However, when the wage rate is forced above the equilibrium wage rate, disequilibrium unemployment may develop. At a wage above the equilibrium the supply of labour will exceed the demand for labour and the excess is unemployment.
By increasing the national minimum wage, firms will face higher labour costs and this may discourage them from taking on new workers, but may also force them into laying off existing workers. The impact of the minimum wage on unemployment doesn’t seem to be as pronounced as labour market models suggest, so perhaps the increase in the minimum wage will help the lowest paid families and we won’t observe any adverse effect on businesses and employment. The following articles consider this story.
National minimum wage to rise to £6.50 The Guardian, Rowena Mason (12/3/14)
Minimum wage up to £6.50 an hour BBC News (12/3/14)
Minium wage to increase by 3% to £6.50 an hour Independent, Maria Tadeo (12/3/14)
Minimum wage rise confirmed Fresh Business Thinking, Daniel Hunter (12/3/14)
Ministers approve minimum wage rise London Evening Standard (12/3/14)
Government to accept proposed 3% minimum wage rise The Guardian, Rowena Mason (4/3/14)
Londoners do not believe minimum wage is enough to live on in the capital The Guardian, Press Association (9/3/14)
Minimum wage: The Low Pay Commission backs a 3% increase BBC News (26/2/14)
Questions
- Using a diagram, illustrate the impact of raising the national minimum wage in an otherwise perfectly competitive labour market.
- How does your answer to question 1 change, if the market is now a monopsony?
- To what extent is elasticity relevant when analysing the effects of the national minimum wage on unemployment?
- How might an increase in the national minimum wage affect public finances?
- Why is an above-inflation increase in the national minimum wage so important?
- What is meant by a Living Wage?
- What do you think the impact on business and the macroeconomy would be if the minimum wage were raised to a ‘Living Wage’?
Many people are attracted to work in the private sector, with expectations of greater opportunities for promotion, more variation in work and higher salaries. However, according to the Office for National Statistics, it may be that the oft-talked-of pay differential is actually in the opposite direction. Data from the ONS suggests that public sector workers are paid 14.5% more on average than those working in the private sector.
As is the case with the price of a good, the price of labour (that is, the wage rate) is determined by the forces of demand and supply. Many factors influence the wages that individuals are paid and traditional theory leads us to expect higher wages in sectors where there are many firms competing for labour. With the government acting as a monopsony employer, it has the power to force down wages below what we would expect to see in a perfectly competitive labour market. However, the ONS data suggests the opposite. What factors can explain this wage differential?
Jobs in the public sector, on average, require a higher degree of skills. There tend to be entry qualifications, such as possessing a university degree. While this is the case for many private-sector jobs as well, on average it is a greater requirement in the public sector. The skills required therefore help to push up the wages that public-sector workers can demand. Another explanation could be the size of public-sector employers, which allows them to offer higher wages. When the skills, location, job specifications etc. were taken into account, the 14.5% average hourly earnings differential declined to between just 2.2% and 3.1%, still in favour of public-sector workers. It then reversed to give private-sector workers the pay edge, once the size of the employer was taken out.
Further analysis of the data also showed that, while it may pay to be in the public sector when you’re starting out on your career, it pays to be in the private sector as you move up the career ladder. Workers in the bottom 5% of earners will do better in the public sector, while those in the top 5% of earners benefit from private-sector employment. The ONS said:
Looking at the top 5%, in the public sector earnings are greater than £31.49 per hour, while in the private sector, the top 5% earn more than £33.63 per hour… The top 1% of earners in the private sector, at more than £60.21 per hour, earns considerably more than the top 1% of earners in the public sector, at more than £49.65 per hour.
The data from the ONS thus suggest a reversal in the trend of average public-sector pay being higher than private sector pay, once all the relevant factors are taken into account.
This will naturally add to debates about living standards, which are likely to take on a stronger political slant as the next election approaches. It is obviously partly down to the public-sector pay freeze that we saw in 2010 and also to a reversal, at least in part, of the previous trend from 2008, where public-sector pay  had been growing faster than private-sector pay. However, depending on the paper you read or the person you listen to, they will offer very different views as to who gets paid more. All you need to do in this case is look at the titles of the newspaper articles written by the Independent and The Telegraph! Whatever the explanation, these new data provide a wealth of information about relative prospects for pay for everyone.
Data
Public and Private Sector Earnings Office for National Statistics (March 2014)
Annual Survey of Hours and Earnings, 2013 Provisional Results Office for National Statistics (December 2013)
Articles
Austerity bites as private sector pay rises above the public sector for the first time since 2010 Independent, Ben Chu (10/3/14)
Public sector workers still better paid despite the cuts The Telegraph, John Bingham (10/3/14)
Public sector hourly pay outstrips private sector pay BBC News (10/3/14)
Public sector workers are biggest losers in UK’s post-recession earnings squeeze The Guardian, Larry Elliott (11/3/14)
New figures go against right-wing claims that public sector workers are grossly overpaid Independent, Ben Chu (10/3/14)
Public sector pay sees biggest shrink on 2010, figures suggest LocalGov, Thomas Bridge (11/3/14)
Public sector staff £2.12 an hour better off The Scotsman, David Maddox (11/3/14)
Questions
- Illustrate the way in which wages are determined in a perfectly competitive labour market.
- Why does monopsony power tend to push wages down?
- Why does working for a large company suggest that you will earn a higher wage on average?
- Using the concept of marginal revenue product of labour, explain the way in which higher skills help to push up wages.
- How significant are public-sector pay freezes in explaining the differential between public- and private-sector pay?
- Why is there a difference between the bottom and top 5% of earners? How does this impact on whether it is more profitable to work in the public or private sector?
 Getting around London is pretty easy to do. Transport, though often criticized, is very effective in and around London – at least when the Underground is running uninterrupted. However, since 9pm on Tuesday 4th February until the morning of 7th February, the underground will be operating well below full capacity, as strike action affects many workers.
Transport for London has plans to cut many jobs, in particular through the closure of ticket office at all stations. Modernisation to the network is said to be essential, not just to improve the existing system, but also as it is predicted to save £50 million per year. Data suggests that only 3% of transactions involve people using ticket offices and thus the argument is that having offices manned is a waste of money and these workers would be better allocated to manning stations. David Cameron said:
I unreservedly condemn this strike. There is absolutely no justification for a strike. We need a modernised tube line working for the millions of Londoners who use it every day.
Workers on London Underground are naturally concerned about the impact this will have, in particular on their jobs, despite assurances that there will be no compulsory redundancies.
 The impact of these strikes on workers in London is clearly evident by any pictures you look at. Buses were over-crowded, despite more than 100 extra being provided, pavements were packed with pedestrians and the roads were full of cyclists. At least the strike action has led to a little more exercise for many people! The disruption to business in London is likely to be relatively large and the loss in revenue due to the action will also be high, estimated by Business leaders to be tens of millions of pounds. It is perhaps for this reason that there is discussion as to whether the underground should be declared an ‘essential service’ as a means of minimising future disruptions.
Discussions have been ongoing between both sides to try to prevent this action and talks are likely to continue in the future. Boris Johnson has declared the strikes as ‘completely pointless’ and both sides have argued that the other has been unwilling to negotiate and discuss the ticket office closures. Boris Johnson said:
A deal is there to be done. I am more than happy to talk to Bob Crow if he calls off the pointless and unnecessary strike.
 The impact on London and the economy will only be fully known after the strike action is over, but there are plans for further strikes next week. The greater the disruption the bigger the calls for further strikes on key services, such as the tube, to be prevented. In particular, this may mean new powers to curtail the rights of unions in these types of areas, which will require a minimum service to be provided. The following articles consider the strike action on the London Underground.
Articles
Questions
- If there is strike action in a labour market, what can we conclude about the market in question in terms of how competitive it is?
- If only 3% of transactions take place via ticket offices, is it an efficient use of resources to maintain the presence of ticket offices at every station?
- Is industrial action ‘completely pointless’?
- What other solutions are there besides strike action to problems of industrial dispute?
- What is the role of ACAS in negotiations?
- What is the economic impact of the strike on the London Underground? Think about the impact on businesses, revenues, sales and both micro and macro consequences.
- Should the tube be seen as an essential service such that strike action by its workers would be restricted?
 Life expectancy is increasing across the world and the latest set of figures from the Office for National Statistics show that in the UK it has passed 79 for boys born in 2010–12, and 82 for girls born then. In fact the prediction is that over a third of babies born in 2013 will live to more than 100. The data throws up some interesting questions. How well prepared are we for lives that last this long? And how evenly distributed is this increase in life expectancy? Pensions’ minister, Steve Webb, has called for better information on life expectancy to be shared. How would this impact on our decision making?
 But while we can look forward to longer life, for the government, it presents some challenges The first is that we just don’t save enough for our old age. This seems to be partly because we find it hard to make decisions that will have an impact so far in the future. There are a number of measures that have been put in place to encourage us to save more, including auto-enrolment into company pension schemes. This is being rolled out across businesses over the next three years. In the 2014 Budget, the Chancellor announced that people reaching retirement age will be able to draw all their pension as a cash lump sum, rather than having to take it as a regular income.