When making a decision, what happens if you do nothing: i.e. take no action? The answer is the default option. There is evidence that changing the default option for the same decision can sometimes have a big impact on the final choices people make. For example, when a person starts a new job, they often have to decide whether to contribute to the company’s pension scheme. The default option is typically for employees not to contribute. They have to do something actively (e.g. fill in an online form) to opt in to the scheme. An alternative is to change the default option so that employees are contributing to the pension. They now have to do something to opt out of the scheme.
Changing the default should have no impact on people who behave in ways that are consistent with the rational choice model in economics. However, research by Madrian and Shea (2001) found that it had a big effect. When employees had to opt-in, 49 per cent enrolled in a company pension. When they had to opt out, the figure increased to 86 per cent.
Other research suggests that defaults can influence the likelihood of getting a flu jab, making healthier food choices, receiving e-mail marketing and choosing certain types of car insurance.
Organ donation
One policy area where the choice of default has become a topical issue is organ donation. In 2017, over 400 people died in the UK because it was impossible to find an appropriate donor. Could changing the default increase the number of donors?
The scheme that operates in England requires people to sign-up to the organ donor register: i.e. they have to opt in. Although 80 per cent of the public support organ donation less than 50 per cent ever get around to signing this register.
Parliament recently approved the Organ Donation Bill and the new law will come into effect in 2020. The default position will change so that people are automatically signed-up for organ donation. If they do not want to donate their organs, they will have to opt out of the register.
In December 2015, the devolved Welsh government introduced a similar scheme. Although it is quite early to give a full assessment of the policy, its impact has been smaller than many people had hoped.
Why have the initial results been disappointing? One potential downside with an opt-out scheme is that it may create greater uncertainty about someone’s true wishes. With an opt-in scheme, a relative takes a deliberate action to indicate their preference to be an organ donor. In England, approximately 10 per cent of families overrule the wishes of a relative who has actively signed the register.
With an opt-out scheme, family members may worry that their relative did not want to donate their organs but never found the time to take their name off the register. In 2017/18, families in Wales overruled the presumed consent of their relatives in 33 per cent of cases.
Some countries, such as Singapore and Austria, operate a ‘hard opt-out’ policy. In these schemes, families cannot overrule and this leads to high organ donor rates. However, this type of policy is unpopular with large sections of the electorate who feel it is over paternalistic.
Forcing people to make a choice
Is it possible to force people to make a choice and so reveal their preferences to others? This is a policy of active choice. For example, the government could make the issuing of a driving licence conditional on a people making a choice about whether or not to sign the organ donor register.
 This type of policy has been trialled in the USA with the take up of home delivered prescriptions. For the majority of people, there are clear advantages of choosing to have home delivered prescriptions rather than visiting a pharmacy – it is both cheaper and involves less time/hassle. However, the default option is to visit a pharmacy and one study found that only 6 per cent of people chose home delivered options. With the introduction of active choice, this figure increased to 42 per cent.
Some have argued that it is socially undesirable to force people to make a choice. An alternative is simplified active choice – people can either make a choice or accept the default option.
Articles
Questions
- Explain why changing the default option should have no impact on people who behave in ways that are consistent with the rational choice model in economics.
- What is present bias? How does it differ from simple impatience? Explain how present bias might help to explain the impact of changing the default option.
- What is loss aversion? How does it differ from diminishing marginal utility? Explain how loss aversion might help to explain the impact of changing the default option.
- What are some of the limitations of using defaults in policy-making?
- Is active choice less paternalistic than changing the default option?
- Think of some reasons why someone may not want to make a choice.
 On 21st February 2019, the Department for International Trade (DIT) published a document outlining the UK’s progress in negotiating new free trade agreements (FTAs) with a number of non-EU countries. It advises UK firms that FTAs with Turkey and Japan will not be finalised before the official exit day from the European Union – 29th March 2019. Many business groups expressed concern at this news.
The EU has successfully negotiated a number of FTAs. These deals enable all 28 states in the European Union Custom Union (EU-CU), including the UK, to trade at preferential (i.e. lower) tariffs with over 70 non-EU countries. These include Canada, South Korea, Mexico, Israel, Norway, South Africa and Turkey. Research by the CBI estimates that UK exports to these countries were approximately £41bn in 2017 – approximately 13 per cent of all UK exports. In July 2018, the EU signed its largest ever FTA – with Japan. This deal covers 635 million people.
 If the UK leaves the European Union without a deal on the 29th March, then it immediately loses membership of the EU-CU. Preferential tariffs will no longer apply to trade between the UK and the non-EU countries which signed the FTAs. Without any new arrangements in place, tariffs and quotas will revert to the non-preferential (i.e. higher) rates outlined in registered schedules with the World Trade Organization.
Given the economic significance of this trade, the UK government has spent the past two years trying to negotiate new FTAs to replace those previously agreed by the EU. For example, on February 11th, the government announced that it had signed a ‘continuity agreement’ with Switzerland covering trade worth £32bn per year. Deals have also been finalised with Chile, Israel, and the Faroe Islands that replicate the terms of the EU agreements. However, government officials informed 30 business groups in early February that it was highly unlikely that most of the new replacement FTAs would be concluded in time for March 29th.
The document published by the DIT on the 21st February confirms this position and describes the current status of most of the new FTAs as:
Engagement ongoing
For both Japan and Turkey, the outlook is more negative. The guidance states:
We will not transition this agreement for exit day.
The head of EU negotiations at the CBI commented that:
We are really concerned that firms could be blindsided by this.
The government stated that it would significantly increase the resources devoted to the trade negotiations and expected to sign more deals over the next couple of weeks.
If the UK leaves the EU on the 29th March with a deal, then it remains in the EU-CU during the 21-month transition period. Trade will still be covered by the 40 existing EU deals. This gives UK officials until the end of December 2020 to conclude a new set of FTAs.
Articles
Government information
Questions
- Using a demand and supply diagram, illustrate the impact of tariffs on imported goods.
- The EU is perhaps the most famous example of a customs union. Find out some other examples.
- Discuss some of the potential disadvantages of free trade.
- Discuss some of the advantages and disadvantages of the UK remaining in the European Union Custom Union.
- What is a ‘registered schedule’ at the World Trade Organization?
Do you want to get drunk this festive season in the most tax efficient way: i.e. minimise the amount of tax you pay for the volume of alcohol that you drink? Do tax rates vary or are all alcoholic drinks taxed in the same or similar way?
 The UK government imposes two different types of tax on alcohol. One is a specific or fixed tax per unit, referred to as excise duty or excise tax. This varies depending on the type of alcohol and is the focus of this blog. The other is VAT, which is 20% of the price for all alcoholic drinks. The price on which VAT is based includes the impact of the excise tax.
How does the implementation of excise tax differ between alcoholic drinks? Both the tax rate itself and the unit of output on which it is based vary: i.e. the volume of liquid vs the volume of pure alcohol within the liquid.
For example, with lager, beer and spirits the excise tax depends on the units of alcohol in the drink rather than the number of litres. The tax works in the following way. It is based on the alcohol by volume or ABV of the lager, beer or spirit. This is often displayed on the bottle or can. ABV is the percentage of the drink that is pure alcohol. Therefore, if a one-litre bottle of lager has an ABV of 1%, then 10ml of the bottle contains pure alcohol. Ten millilitres of pure alcohol is one unit of alcohol. If a one litre bottle of lager had an ABV of 5% it contains 5 units of alcohol.
Excise duties on spirits are the simplest of all the alcohol taxes. The rate for 2017/18 is 28.74p for each percentage of ABV or unit of alcohol in a one-litre bottle. Most spirits have an ABV of 40%. This means that there are 40 units of alcohol in a litre bottle and the excise tax payable on that bottle is £11.50 (40 × 28.74p). If a litre bottle had an ABV of 57%, such as Woods Navy Rum, then the excise tax would be or £16.38 (57 × 28.74p). Although the volume of liquid is the same in each case, the excise tax has increased by £4.88 because the alcohol content has increased.
For cider and wine the system is quite different. Within certain bands of alcoholic strength, the excise duty is based on the volume of the drink rather than by its ABV. For example, the excise tax on a litre of cider with an ABV of between 1.2% and 7.5% is 40.38p. This has the effect of reducing the tax rate per unit of alcohol as the alcoholic content of the cider increases (up to a limit of 7.5%). For example, the rate of excise tax per unit of alcohol for a litre bottle of cider with an ABV of 2% is 20.19p (40.38/2) whereas for a litre bottle of cider with an ABV of 7.5% it is just 5.39p (40.38/7.5). Wine is taxed in a similar way. A litre of wine with an ABV of between 5.5% and 15% is taxed at 288.65p per litre.
The excise tax rates per unit of alcohol for different drinks are illustrated below.
|
Drink
|
ABV
|
Excise tax per
unit of alcohol
|
| Beer/lager |
5%
|
19.08p
|
| Beer/lager |
8%
|
24.77p
|
| Spirits |
1-100%
|
28.74p
|
| Wine |
12.5%
|
21.90p
|
| Wine |
15%
|
19.24p
|
| Cider |
5%
|
8.08p
|
| Cider |
7.5%
|
5.39p
|
The table clearly shows that cider with an ABV of 7.5 per cent is by far the most tax effective way of consuming alcohol.
Although this blog is a rather light-hearted look at excise tax, it does help to illustrate the strange anomalies of the system used in the UK. Research by the Institute for Fiscal Studies (IFS) has indicated that heavier drinkers are more likely to switch between different alcoholic products in response to price changes. They also tend to drink products with more units of alcohol in them: i.e. spirits such as whisky and gin. For these reasons, the IFS has suggested that the excise tax rates on cider and spirits should be increased.
In the November budget, the Chancellor announced plans to introduce a new excise tax rate on still cider with an ABV of between 6.9% and 7.5%.
The excise taxes on cider and wine are based on the volume of liquid because of the European Community Directive 92/84/EEC. It will be interesting to see if the government changes this system to one based on alcohol content once the UK had left the European Union.
Articles
Budget 2017 – Why is white cider being taxed more? BBC News (22/11/17)
Is it time for a flat tax on alcohol – health campaigners can drink to that The Telegraph, Christopher Snowdon (15/2/17)
Traditional cider makers say tax on strong brands will hurt their business The Guardian, Rob Davies (22/11/17)
Minimum price would increase cost of 70% of alcohol BBC News (15/12/17)
 Designing alcohol taxes IFS, Kate Smith (24/4/17) .
Questions
- Explain the difference between an ad valorem tax and a specific tax.
- Illustrate the impact of an ad valorem tax and a specific tax on a demand and supply diagram.
- What is the excise tax rate per unit of alcohol on a litre bottle of cider with an ABV of 6%?
- What is the economic rationale for imposing excise tax on alcohol?
- How will the external costs of consuming alcohol differ from those of smoking cigarettes? Draw a marginal external cost of consumption curve for both products to illustrate the difference.
- Compare the impact of increasing excise tax rates on cider and spirits with introducing a minimum unit price for alcohol.
- In April 2012 the government in England and Wales imposed a ban on ‘below cost’ pricing of alcohol. Explain how this policy works and what impact you think it has had.
 Concerns have been expressed about the UK’s relatively poor record of upgrading broadband services so that households can receive ultrafast connectivity. Some commenters have argued that future economic growth prospects will be harmed if the UK continues to lag behind its leading rivals.
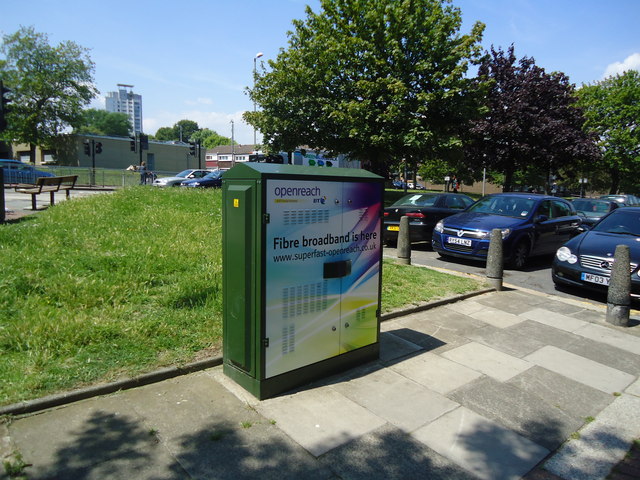
Much of the fixed line system that allows people to connect to broadband was originally installed many years ago for the land-line telephone network. The so called ‘final mile’ consists of copper-based wiring that is carried from street cabinets to the premises of the end-user. This wiring is transported via a huge network of telegraph poles and cable ducts (small underground tunnels).
In order for people to gain connectivity to ultrafast broadband this copper based wiring needs to be replaced by fibre optic cables. This is commonly referred to as Fibre to the Premises (FTTP). Unfortunately, the UK has a relatively poor record of installing FTTP. Japan and Korea were forecast to have 70% and 63% coverage by the end of 2015 as opposed to just 2% in the UK.
Why is the UK’s record so poor? Many observers blame it on the structure of the industry. In other network industries, such as those for gas pipeline and electricity grids, the business responsible for managing the infrastructure, National Grid, is a regulated monopoly. This company does not directly supply services to consumers using the network it is responsible for maintaining. Instead, customers are supplied by the retail sector of the industry, where firms compete for their business. This sector includes the so-called ‘big six’ (British Gas; npower; SSE; Scottish Power; EDF; E.On) and a number of smaller suppliers such as Ovo Energy and Ebico.

The structure of the fixed line telecommunications sector is very different. The company that manages the ‘final mile’, Openreach, is a subsidiary of BT. BT also competes with other Internet Service Providers (ISPs), such as TalkTalk and Sky, to supply broadband to customers using this network. Its market share of 32 per cent makes it the largest player in the broadband market. Sky and TalkTalk have market shares of 22 per cent and 14 per cent respectively. Virgin Media also supplies 20 per cent of this market using its own network of ducts and cables.
Given that in most cases ISPs such as Sky and TalkTalk are stuck with the network Openreach provides, BT may have limited incentives to invest. It can still earn a good return from its infrastructure of copper-based wiring and avoid installing expensive FTTP. Dido Harding, the chief executive of TalkTalk, argued that:
“We need to separate Openreach from the rest of BT to create a more competitive, pro-investment market”
Ofcom, in its recent review of the market, has taken a different approach. Rather than creating an entirely separate monopoly business to manage the network (i.e. splitting Openreach from BT), the regulator instead opted for a policy of encouraging competition between different suppliers that deploy fibre optic cables. It states in the report that:
“We believe competition between different networks is the best way to drive investment in high-quality, innovative services for customers.”
This competition could come from ISPs such as TalkTalk and Sky or other smaller network providers such as CityFibre and Gigaclear.
One major problem with this approach is that potential new entrants might be deterred from entering the market because of the very high initial costs involved in building a new network in order to deploy FTTP. In particular, the costs of digging up the roads and laying the ducts are considerable. Matt Yardley, author of a study on the industry, said:
“It is widely accepted that civil works such as digging trenches account for up to 80% of broadband deployment costs.”
One way of reducing these costs and encouraging more competition is to allow rival firms access to the existing ducts and poles that are currently managed by Openreach. Once access has been obtained, these firms could effectively rent space inside the ducts and lay fibre optic cables alongside the existing copper-based wiring. Vodafone reported that a similar policy in Spain had reduced its capital expenditure of building FTTP by 40 per cent compared with constructing its own network of ducts and poles.
Ofcom first introduced this type of policy in 2010 when it launched its Physical Infrastructure Access (PIA) initiative. Unfortunately it has proved to be relatively unsuccessful with very little demand for PIA from rival firms. The success of this type of policy will depend on a number of factors including (1) the prices charged by Openreach to access and rent space inside the ducts; (2) the simplicity of any relevant administration; and (3) the availability and reliability of information about the ducts. With this last point, key issues include:
|
|
| • |
Where they are located . |
| • |
How much space is available: i.e. is there enough space for firms to lay fibre optic cables alongside the existing wiring? |
| • |
What condition they are in: i.e. are they flooded or clogged up with sand and mud, which will involve expensive work to make them usable again?
|
Firms did complain about the pricing structures and bureaucratic nature of the administration process under the PIA scheme. However, their most significant concerns were about the uncertainty that was created by the lack of information about the ducts and poles. For example, analysts from the consultancy firm, Reburn, argued that if a firm contacted Openreach to try to obtain access to the network it was informed that:
“We don’t know what condition the ducts and poles are in. Please pay £10 000 for a survey. Also unfortunately we are rather busy and we can only start in six weeks.”
Matthew Hare, the chief executive of Gigaclear, argued that it was like going to a shop where the assistant says:
“Give me some money, and I’ll tell you whether you can have it or not.”
In response to these criticisms Ofcom has introduced a number of changes to PIA, which has been re-named Duct and Pole Access (DPA). In particular, it has imposed a new requirement on Openreach to create a database that provides information on the location, condition and capacity of its ducts and poles. The database must be made available to rival ISPs and network providers. DPA must also be provided on the same timescales, terms and conditions to all businesses including other parts of BT – this is referred to as ‘equivalence of inputs’.
The first big test of this policy is in Southend where City Fibre is hoping to deploy 50km of fibre optic cables using DPA. However, reports in the media have suggested that the initial surveys have found very limited capacity in some of the ducts, which would make DPA impossible.
It will be interesting to see how the trial in Southend progresses. If it is successful, then DPA may be viable for about 40 per cent of premises in the UK. If it fails, then Ofcom might ultimately have to force Openreach to be completely separated from BT.
Articles
How the gothic city of York became a broadband battleground The Telegraph, Kate Palmer (22/5/16)
City Fibre first to mount BT challenge after Openreach is told to share network The Telegraph, Kate Palmer (1/3/16)
Challenges as CityFibre Moot Using BT Cable Ducts in Southend-on-Sea ISPreview, Mark Jackson (2/5/16)
CityFibre to build pure fibre infrastructure for Southend Networking (5/4/16)
Ofcom tells BT to open up infrastructure to rivals The Guardian, Rob Davies (26/2/16)
Questions
- Draw an average total cost curve to illustrate the economics of building a network of ducts and poles. Label the minimum efficient scale.
- To what extent does DPA create a contestable market?
- For DPA to deliver productive efficiency, what must be true about the economies of scale of laying fibre optic cables?
- In the run-up to Ofcom’s review of the telecoms industry, many commentators described Openreach as being a natural monopoly. To what extent do you agree with this argument?
- What are the advantages of marginal cost pricing? What issues might a regulator face if it tried to impose marginal cost pricing on a natural monopoly?
- Using a diagram, explain how the network of ducts and poles might be a natural monopoly in rural areas but not in densely populated urban areas.
- Discuss how Ofcom has tried to increase the level of separation between Openreach and BT.
 In April 2015 the European Commission (EC) opened a formal investigation into the behaviour of Google in the market for smartphones and tablets. On the 20th April Google was sent a preliminary judgment (referred to formally as a Statement of Objections) in which it was accused of abusing its dominant market position. The European Commissioner argued that the case was similar to the famous and protracted investigation into the conduct of Microsoft.
In the early 2000s Microsoft had a dominant position in the market for desktop operating systems. It has been estimated that 97% of all computing devices at the time used Microsoft Windows. This market power attracted the attention of the EC who accused the company of using its dominance in the operating systems market to restrict competition in complementary markets for software such internet browsers and media players. This led to a complex legal battle between the two parties.
Windows is proprietory software and computer manufacturers have to pay Microsoft a licence fee to install it on their machines. Before the rulings by the EC, Microsoft could make a licence for Windows conditional on other Microsoft software such as Internet Explorer and Media Player being pre-installed. This is known as bundling and in this case the EC came to the conclusion that it restricted competition. The European Commissioner, Margrethe Vestager recently stated that
“If Microsoft’s media player was already there when you bought a PC, it would be hard to persuade people to even try an alternative, so innovators would be at a big disadvantage”
Microsoft lost most of its competition battles with the EC and had to pay a total of €2.2 billion in various fines. It was also forced to change its conduct. For example, the EC instructed Microsoft to provide its users with a choice of internet browsers.
The marketplace for operating systems has gone through some significant changes since the early 2000s. By 2016 Microsoft’s market share had fallen to 26 per cent. One of the major reasons for this decline has been the increasing popularity of smartphones and tablets.
Google’s Android operating system dominates the mobile market with a market share of over 80 per cent. However, the economics of the Android operating system are very different from those of Windows. Unlike Windows, Android is an example of ‘open-source software’. This means that, rather than having to obtain a licence fee, mobile handset or tablet manufacturers can freely install Android on their devices and are not obliged to pre-install other Google software – both Amazon and Nokia have done this. ,
Another major difference is that it is relatively straightforward for rival firms to develop software that can run on Android. Microsoft was accused of making it very difficult for rival software companies to develop products that would run smoothly on the Windows operating system.
It would appear far easier for rival firms to compete with Google than it ever was with Microsoft when it had a dominant market position. It might therefore seem surprising that the EC has accused Google of abusing its dominant market position.
Rather than any restrictions surrounding the licencing conditions for the operating system the EC’s objections to Google’s behaviour focus on its licencing conditions for other proprietary software products it provides. In particular, the EC has focused on the Google Play Store.

The pre-installation of the Google Play Store is seen as vital to the commercial success of any Android phone. Google Play Store was launched in 2012 and brought three previously separate services together – Android Market, Google Music and Google eBookstore. It is the official app store for all users of a device with an Android operating system. It has been argued that a mobile phone store would not stock an Android phone unless it had Google Play Store pre-installed because it is so highly valued by customers.
Therefore it is vital for Android smartphone and tablet manufacturers to obtain a licence for the Play Store. The conditions for obtaining a licence are outlined in the Mobile Application Distribution Agreement. This specifies that a number of other Google apps must also be pre-installed on the device in order for a licence to be granted for the Play Store. These apps include Gmail, Google Chrome, Google Drive, Google Hangouts, Google Maps, Google Search and YouTube. The manufacturer is free to install any other non-google apps.
The EC has specifically objected to the condition that Google Search has to be installed and set as the default search engine. It is concerned that this that will make it very difficult for other search services to compete with Google because (1) manufacturers will have limited incentives to pre-install any competing search engines and (2) consumers will have less incentive to download competing search engines.
The EC has also expressed concerns that the pre-installation of Google Chrome as the mobile browser will also have a negative impact on competition and innovation in this market.
Companies are given 12 weeks to respond after they have received a preliminary judgment. If they do not accept the objections, then the EC will take several months to come to a final ruling and suggest some appropriate remedies. In this case, the most likely remedy is the removal of the licence conditions for the Google Play Store. If Google appeals the ECs decision to the General Court of the EU, it could take years until a final judgment is made.
Murad Ahmed, the European Technology Correspondent at the Financial Times commented that
“One lesson Google might want to learn from Microsoft’s example is while it fights the EU watchdog it is not overtaken by a less distracted competitor.”
Articles
Europe v Google: how Android became a battleground The Guardian (20/4/16)
EU accuses Google of using Android to skew market against rivals The Guardian (20/4/16)
Google faces EU charge over Android ‘abuse of dominance’ BBC News (20/4/16)
Google hit with EU competition charges for ‘abusing’ dominant position with Android Independent (20/4/16)
Everything you need to know about Google and its EU battle The Telegraph (20/4/16)
Questions
- Draw a diagram to compare and contrast the price and quantity in a competitive market with a situation where a firm has market dominance. Clearly state any assumptions you have made in the analysis.
- What factors does the EC consider when judging if a firm has a dominant position in the market?
- This blog has focused on one aspect of Google’s behaviour/conduct that has raised concerns with the EC. What other elements of Google’s conduct has the European Commission objected to?
- Explain the difference between pure and mixed bundling.
- What impact does bundling have on consumer welfare?