Ten years ago, the financial crisis deepened and stock markets around the world plummeted. The trigger was the collapse of Lehman Brothers, the fourth-largest US investment bank. It filed for bankruptcy on September 15, 2008. This was not the first bank failure around that time. In 2007, Northern Rock in the UK (Aug/Sept 2007) had collapsed and so too had Bear Stearns in the USA (Mar 2008).
Initially there was some hope that the US government would bail out Lehmans. But when Congress rejected the Bank Bailout Bill on September 29, the US stock market fell sharply, with the Dow Jones falling by 7% the same day. This was mirrored in other countries: the FTSE 100 fell by 15%.
At the core of the problem was excessive lending by banks with too little capital. What is more, much of the capital was of poor quality. Many of the banks held securitised assets containing ‘sub-prime mortgage debt’. The assets, known as collateralised debt obligations (CDOs), were bundles of other assets, including mortgages. US homeowners had been lent money based on the assumption that their houses would increase in value. When house prices fell, homeowners were left in a position of negative equity – owing more than the value of their house. With many people forced to sell their houses, prices fell further. Mortgage debt held by banks could not be redeemed: it was ‘sub-prime’ or ‘toxic debt’.
Response to the crisis
The outcome of the financial crash was a series of bailouts of banks around the world. Banks cut back on lending and the world headed for a major recession.
Initially, the response of governments and central banks was to stimulate their economies through fiscal and monetary policies. Government spending was increased; taxes were cut; interest rates were cut to near zero. By 2010, the global economy seemed to be pulling out of recession.
However, the expansionary fiscal policy, plus the bailing out of banks, had led to large public-sector deficits and growing public-sector debt. Although a return of economic growth would help to increase revenues, many governments felt that the size of the public-sector deficits was too large to rely on economic growth.
As a result, many governments embarked on a period of austerity – tight fiscal policy, involving cutting government expenditure and raising taxes. Although this might slowly bring the deficit down, it slowed down growth and caused major hardships for people who relied on benefits and who saw their benefits cut. It also led to a cut in public services.
 Expanding the economy was left to central banks, which kept monetary policy very loose. Rock-bottom interest rates were then accompanied by quantitative easing. This was the expansion of the money supply by central-bank purchases of assets, largely government bonds. A massive amount of extra liquidity was pumped into economies. But with confidence still low, much of this ended up in other asset purchases, such as stocks and shares, rather than being spent on goods and services. The effect was a limited stimulation of the economy, but a surge in stock market prices.
With wages rising slowly, or even falling in real terms, and with credit easy to obtain at record low interest rates, so consumer debt increased.
Lessons
So have the lessons of the financial crash been learned? Would we ever have a repeat of 2007–9?
On the positive side, financial regulators are more aware of the dangers of under capitalisation. Banks’ capital requirements have increased, overseen by the Bank for International Settlements. Under its Basel II and then Basel III regulations (see link below), banks are required to hold much more capital (‘capital buffers’). Some countries’ regulators (normally the central bank), depending on their specific conditions, exceed these the Basel requirements.
But substantial risks remain and many of the lessons have not been learnt from the financial crisis and its aftermath.
There has been a large expansion of household debt, fuelled by low interest rates. This constrains central banks’ ability to raise interest rates without causing financial distress to people with large debts. It also makes it more likely that there will be a Minsky moment, when a trigger, such as a trade war (e.g. between the USA and China), causes banks to curb lending and consumers to rein in debt. This can then lead to a fall in aggregate demand and a recession.
Total debt of the private and public sectors now amounts to $164 trillion, or 225% of world GDP – 12 percentage points higher than in 2009.
China poses a considerable risk, as well as being a driver of global growth. China has very high levels of consumer debt and many of its banks are undercapitalised. It has already experienced one stock market crash. From mid-June 2015, there was a three-week fall in share prices, knocking about 30% off their value. Previously the Chinese stock market had soared, with many people borrowing to buy shares. But this was a classic bubble, with share prices reflecting exuberance, not economic fundamentals.
Although Chinese government purchases of shares and tighter regulation helped to stabilise the market, it is possible that there may be another crash, especially if the trade war with the USA escalates even further. The Chinese stock market has already lost 20% of its value this year.
Then there is the problem with shadow banking. This is the provision of loans by non-bank financial institutions, such as insurance companies or hedge funds. As the International Business Times article linked below states:
A mind-boggling study from the US last year, for example, found that the market share of shadow banking in residential mortgages had rocketed from 15% in 2007 to 38% in 2015. This also represents a staggering 75% of all loans to low-income borrowers and risky borrowers. China’s shadow banking is another major concern, amounting to US$15 trillion, or about 130% of GDP. Meanwhile, fears are mounting that many shadow banks around the world are relaxing their underwriting standards.
Another issue is whether emerging markets can sustain their continued growth, or whether troubles in the more vulnerable emerging-market economies could trigger contagion across the more exposed parts of the developing world and possibly across the whole global economy. The recent crises in Turkey and Argentina may be a portent of this.
 Then there is a risk of a cyber-attack by a rogue government or criminals on key financial insitutions, such as central banks or major international banks. Despite investing large amounts of money in cyber-security, financial institutions worry about their vulnerability to an attack.
Any of these triggers could cause a crisis of confidence, which, in turn, could lead to a fall in stock markets, a fall in aggregate demand and a recession.
Finally there is the question of the deep and prolonged crisis in capitalism itself – a crisis that manifests itself, not in a sudden recession, but in a long-term stagnation of the living standards of the poor and ‘just about managing’. Average real weekly earnings in many countries today are still below those in 2008, before the crash. In Great Britain, real weekly earnings in July 2018 were still some 6% lower than in early 2008.
Articles
- The Lehman Brothers Crash And The Chaos That Followed – Everything You Need To Know
HuffPost, Isabel Togoh (15/9/18)
- Ten years after the crash: have the lessons of Lehman been learned?
The Guardian, Yanis Varoufakis, Ann Pettifor, Mark Littlewood, David Blanchflower, Olli Rehn, Nicky Morgan and Micah White (14/9/18)
- Financial crisis 10 years on: Who are the winners and losers?
Independent, Kate Hughes (14/9/18)
- Investment winners and losers 10 years after the crash
Financial Times, Kate Beioley (14/9/18)
- Nine Lessons From the Global Financial Crisis
Bloomberg, Mohamed A. El-Erian (13/9/18)
- Lehman — why we need a change of mindset
Deutsche Welle, Thomas Straubhaar (14/9/18)
- ‘The world is sleepwalking into a financial crisis’ – Gordon Brown
The Guardian, Larry Elliott (12/9/18)
 Economists warn of new financial crisis on anniversary of 2008 crash
Channel 4 news, Helia Ebrahimi (15/9/18)
- Financial crisis 2008: Five biggest risks of a new crash
International Business Times, Nafis Alam (14/9/18)
- Carney warns against complacency on 10th anniversary of financial crisis
BBC News, Kamal Ahmed (12/9/18)
- A cyberattack could trigger the next financial crisis, new report says
CNBC, Bob Pisani (13/9/18)
Information and data
Questions
- Explain the major causes of the financial market crash in 2008.
- Would it have been a good idea to have continued with expansionary fiscal policy beyond 2009?
- Summarise the Basel III banking regulations.
- How could quantitative easing have been differently designed so as to have injected more money into the real sector of the economy?
- What are the main threats to the global economy at the current time? Are any of these a ‘hangover’ from the 2007–8 financial crisis?
- What is meant by ‘shadow banking’ and how might this be a threat to the future stability of the global economy?
- Find data on household debt in two developed countries from 2000 to the present day. Chart the figures. Explain the pattern that emerges and discuss whether there are any dangers for the two economies from the levels of debt.
 How much do you know about cryptocurrencies? Even if you don’t know much you are very likely to have heard about the most popular member of the family: Bitcoin. Bitcoin (BTC) has been around for some time now (see the blog Bubbling Bitcoin). It was first released in 2009 by its inventor (the mysterious Satoshi Nakamoto, whose real identity still remains unknown), and since then it has gradually increased in popularity.
According to the Bitcoin Market Journal (a specialised blog, commenting on trends in digital currencies – primarily Bitcoin), there are currently about 29 million digital wallets holding at least 0.001 BTC, although some individual users may own multiple wallets.
Although BTC is the most popular digital currency (and the first one to become widely recognisable), it is certainly not the only one. There are currently more than 400 recognisable cryptocurrencies traded in special digital exchanges (twice this number if you count smaller, less successful ones) with a total capitalisation of $700 billion at its peak (January 3, 2018) – although since then the market has lost a significant part of this value (but it’s still worth 100s of billion of US dollars).
If you have heard about Bitcoin before, chances are you first searched for it sometime between December 2017 and January 2018; that is when the value of Bitcoin soared to $20 000 a piece. A search on Google Trends (a Google utility that shows how many people have searched over a period of time for a certain term – in this case “Bitcoin”) shows this very clearly.

So what do people do with Bitcoin and other cryptocurrencies? The truth is that the majority of users use them for speculative purposes: they buy and sell them, in the hope of making a profit. Due to its extreme volatility (it is very common for the price of the larger cryptocurrencies to fluctuate by 10–20% daily) and the unregulated nature of the cryptocurrency market, it is hardly surprising that most users treat them as very high-risk commodity. This is also why digital currencies tend to attract attention (and new users) when their price soars.
However, cryptocurrencies are not only used for speculation. They can also be used to facilitate transactions. Indeed, according to Wikipedia, there are currently more than 100 000 merchants accepting BTC as a form of payment (online or offline with wallet readers). Financial technology (‘Fintech’) is catching up with this market and some new companies try to compete with the traditional payment networks (Mastercard, Visa and others) by launching plastic cards linked with crypto-wallets (primarily Bitcoin).
Santander bank has expressed an interest in exploring this market further. It is certain that if the market for cryptocurrencies keeps growing at this pace, there will be a lot more challenger fintech firms launching new products that will make it easier to use digital currencies in everyday life.
 Cryptocurrencies, therefore, are likely to have a significant impact on the way we pay for our transactions. They can be used to lower transaction costs (e.g. by simplifying the process of sending money abroad), speed up the processing of payments, facilitate microfinancing and transactions in some of the poorest places on earth – where the closest bank may be 50 miles away or further from where people live).
But there is a dark side to these products. They have been linked to tax-evasion for instance, as many people who trade digital currencies fail to declare capital gains to national tax authorities. They can be used to overcome capital controls and other restrictions imposed by national governments (the case of Greece comes to mind as a recent example).
They have also been blamed for facilitating illegal trading activities, such as in drugs and weapons, due to the anonymity that some of these coins are thought to offer to their users – although quite often they are much easier to trace than their users believe.
Cryptocurrencies do have the potential to change the way we live. They also have the potential to become the biggest Ponzi scheme in the history of mankind.
Over the next few months, I will write a number of blogs to explore the literature on the economics of cryptocurrencies, and discuss some of the major challenges that needs to be overcome if this technology is to become mainstream.
Articles and information
Questions
- How much do you know about Bitcoin and other cryptocurrencies? When did you first find out about them and what triggered your interest?
- Would you be willing to accept payment in BTC? Why yes? Why no?
- Identify five ways in which the use of cryptocurrencies can benefit or damage the global economy.
 On 8 February, the Bank of England issued a statement that was seen by many as a warning for earlier and speedier than previously anticipated increases in the UK base rate. Mark Carney, the governor of the Bank of England, referred in his statement to ‘recent forecasts’ which make it more likely that ‘monetary policy would need to be tightened somewhat earlier and by a somewhat greater extent over the forecast period than anticipated at the time of the November report’.
A similar picture emerges on the other side of the Atlantic. With labour markets continuing to deliver spectacularly high rates of employment (the highest in the last 17 years), there are also now signs that wages are on an upward trajectory. According to a recent report from the US Bureau of Labor Statistics, US wage growth has been stronger than expected, with average hourly earnings rising by 2.9 percent – the strongest growth since 2009.
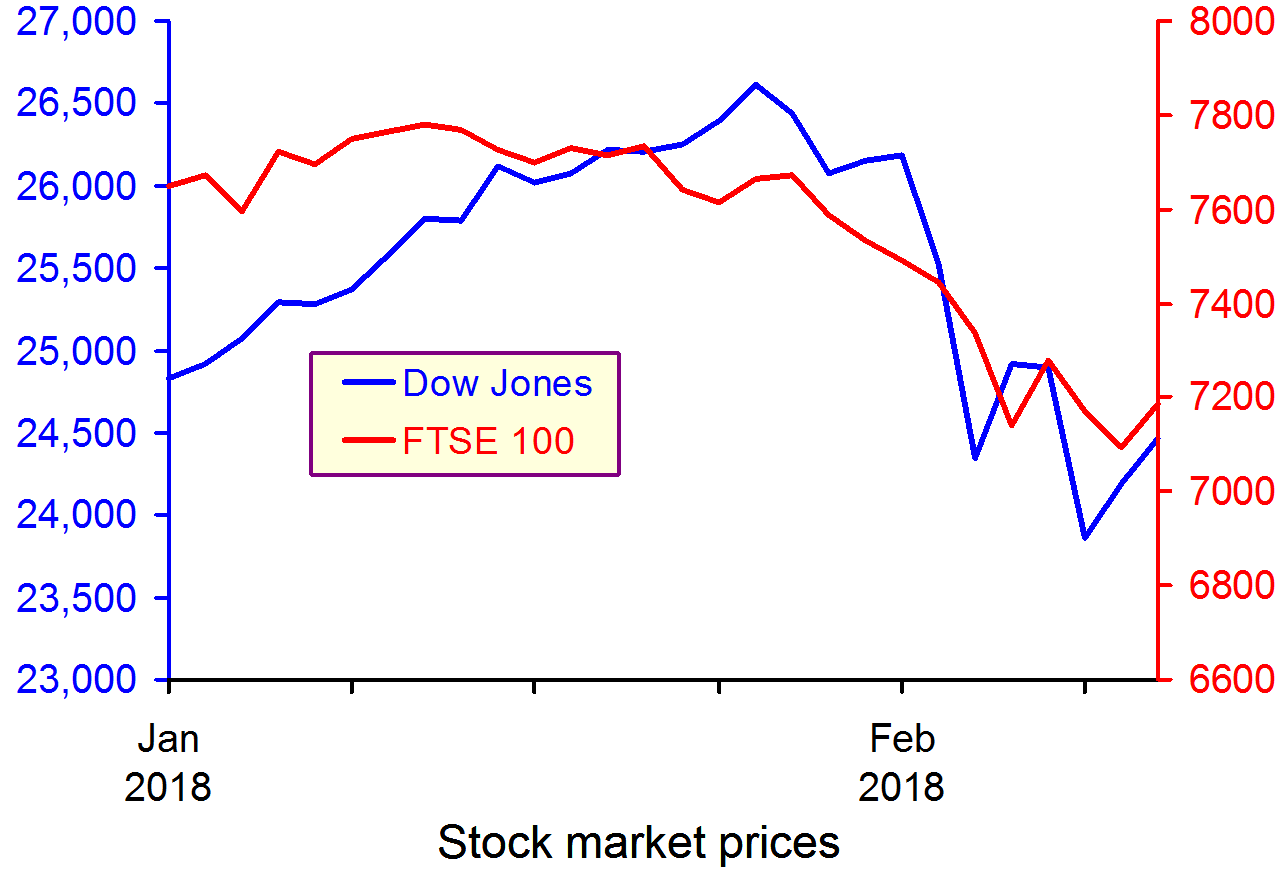
 These statements have coincided with a week of sharp corrections and turbulence in the world’s largest capital markets, as investors become increasingly conscious of the threat of rising inflation – and the possibility of tighter monetary policy.
The Dow Jones plunged from an all-time high of 26,186 points on 1 February to 23,860 a week later – losing more than 10 per cent of its value in just five trading sessions (suffering a 4.62 percentag fall on 5 February alone – the worst one-day point fall since 2011). European and Asian markets followed suit, with the FTSE-100, DAX and NIKKEI all suffering heavy losses in excess of 5 per cent over the same period.
 But why should higher inflationary expectations fuel a sell-off in global capital markets? After all, what firm wouldn’t like to sell its commodities at a higher price? Well, that’s not entirely true. Investors know that further increases in inflation are likely to be met by central banks hiking interest rates. This is because central banks are unlikely to be willing or able to allow inflation rates to rise much above their target levels.
The Bank of England, for instance, sets itself an inflation target of 2%. The actual ongoing rate of inflation reported in the latest quarterly Inflation Report is 3% (50 per cent higher than the target rate).
Any increase in interest rates is likely to have a direct impact on both the demand and the supply side of the economy.
Consumers (the demand side) would see their cost of borrowing increase. This could put pressure on households that have accumulated large amounts of debt since the beginning of the recession and could result in lower consumer spending.
Firms (the supply side) are just as likely to suffer higher borrowing costs, but also higher operational costs due to rising wages – both of which could put pressure on profit margins.
It now seems more likely that we are coming towards the end of the post-2008 era – a period that saw the cost of money being driven down to unprecedentedly low rates as the world’s largest economies dealt with the aftermath of the Great Recession.
For some, this is not all bad news – as it takes us a step closer towards a more historically ‘normal’ equilibrium. It remains to be seen how smooth such a transition will be and to what extent the high-leveraged world economy will manage to keep its current pace, despite the increasingly hawkish stance in monetary policy by the world’s biggest central banks.
Video
Dow plunges 1,175 – worst point decline in history CNN Money, Matt Egan (5/2/18)
Articles
Global Markets Shed $5.2 Trillion During the Dow’s Stock Market Correction Fortune, Lucinda Shen (9/2/18)
Bank of England warns of larger rises in interest rates Financial Times, Chris Giles and Gemma Tetlow (8/2/18)
Stocks are now in a correction — here’s what that means Business Insider, Andy Kiersz (8/2/18)
US economy adds 200,000 jobs in January and wages rise at fastest pace since recession Business Insider, Akin Oyedele (2/2/18)
Questions
- Using supply and demand diagrams, explain the likely effect of an increase in interest rates to equilibrium prices and output. Is it good news for investors and how do you expect them to react to such hikes? What other factors are likely to influence the direction of the effect?
- Do you believe that the current ultra-low interest rates could stay with us for much longer? Explain your reasoning.
- What is likely to happen to the exchange rate of the pound against the US dollar, if the Bank of England increases interest rates first?
- Why do stock markets often ‘overshoot’ in responding to expected changes in interest rates or other economic variables
 The UK is a productivity laggard. Compared to many developed countries over the recent past it has experienced weaker growth in output per worker and output per hour worked. This is detrimental to our longer-term well-being and to peoples’ living standards. An important contributory factor has been the weakness of growth in (non-financial) capital per worker. Recent ONS figures show that UK experienced a decline in capital per worker from 2012 to 2015, which was only ended in 2016.
Non-financial capital assets (also known as fixed assets) are defined as already-produced, durable goods or any non-financial asset used in the production of goods or services. This includes items such as dwellings, buildings, ICT, machinery and transport equipment.
 Chart 1 shows the value of net capital assets in the UK since 1995. ‘Net’ figures account for the depreciation of assets and so reflect the market value of the capital stock. At the end of 2016 the net capital stock was estimated at £7.54 trillion (at 2015 prices) compared to £4.94 trillion (at 2015 prices) in 1995, an increase of 53 per cent or about 2.4 per cent per year.
However, as the chart shows, the rate of growth slowed markedly following the financial crisis of the late 2000s, averaging a mere 0.8 per cent per year since 2010. (Click here for a Powerpoint of the chart).
Capital intensity can be measured by the amount of capital per employee. Capital intensity is important because the growth in net capital per employee impacts on productivity. Its growth has an impact on the current effectiveness of capital and labour in production and on the future growth in potential output per employee.
 Chart 2 shows that, following the financial crisis, falling employment levels temporarily boosted the growth in net capital per employee. Then, as employment levels recovered and began growing again, the weakness in investment meant that net capital per employee began to fall.
In 2016, as employment growth slowed, the now stronger flows of investment meant that, for the first time since 2011, net capital per employee was finally rising again. (Click here for a PowerPoint of the chart).
The persistent weakness experienced by UK in the growth of capital intensity in the 2010s is a drag on productivity and on supply-side growth. The weakness of UK productivity growth looks like remaining for some time one of the biggest economic challenges facing policymakers. Productivity needs its capital.
Articles
UK business investment on ice until more Brexit progress, warns BCC The Guardian, Richard Partington (11/12/17)
Budget 2017: Can Digital Plug The UK’s Productivity Gap? Hufttington Post, William Newton (27/11/17)
UK productivity estimates must be ‘significantly’ lowered, admits OBR The Guardian, Richard Partington and Phillip Inman (13/12/17)
UK productivity sees further fall BBC News (6/10/17)
Data
Capital stocks, consumption of fixed capital in the UK: 2017 ONS
Questions
- How might we measure productivity?
- Compose a list of items that are examples of non-financial (or fixed) capital.
- How can the growth of non-financial (or fixed) capital affect productivity?
- What is meant by capital intensity? Why is this concept important for long-term growth?
- What factors might affect the rate of capital accumulation? Are there interventions that governments can make to impact on the rate of capital accumulation?
- Discuss the possible reasons why the UK has become a productivity laggard.
What do tulips, nickel mining in Australia, South Seas trading, Beanie Babies and cryptocurrencies have in common? The answer is that they have all been the subject of speculative bubbles. In the first four cases the bubble burst. A question currently being asked is whether it will happen to bitcoin.
Bitcoin
Bitcoin was created in 2009 by an unknown person, or people, using the alias Satoshi Nakamoto. It is a digital currency in the form of a line of computer code. Bitcoins are like ‘electronic cash’ which can be held or used for transactions, with holdings and transactions heavily encrypted for security – hence it is a form of ‘crytocurrency’. People can buy and sell bitcoins for normal currencies as well as using them for transactions. People’s holdings are held in electronic ‘wallets’ and can be accessed on their computers or phones via the Internet. Transfers of bitcoins from one person or organisation to another are recorded in a public electronic ledger in the form of a ‘blockchain‘.
The supply of bitcoins is not controlled by central banks; rather, it is determined by a process known as ‘mining’. This involves individuals or groups solving complex and time-consuming  mathematical problems and being rewarded with a new block of bitcoins.
The supply of bitcoins is currently growing at around 150 per hour and the current supply is around ₿16.7 million. However, the number of new bitcoins in a block is halved for every 210,000 blocks. This means that the rate of increase in the supply of bitcoins is slowing – the number generated being halved roughly every four years. The supply will eventually reach a maximum of ₿21 million, probably sometime in the next century, but around 99% will have been mined by around 2032.
The bitcoin bubble
The price of bitcoins has soared in recent months and especially in the past two. On 4 October, the price of a bitcoin was $4226; by 7 December it was nearly four times higher, at $16,858 – a rise of 399% in just nine weeks. Many people have claimed that this is a bubble, which will soon burst. Already there have been severe fluctuations. By December 10, for example, the price had fallen at one point to $13,152 – a fall of nearly 22% in just two days – only to recover to over $15,500 within a few hours.
So what determines the price of bitcoin? The simple answer is very straightforward – it’s determined by demand and supply. But what has been happening to demand and supply and why? And what will happen in the near and more distant future?
As we have seen, the supply is limited by the process of mining, which allows a relatively stable, but declining, increase. The explanation of the recent price rise and what will happen in the future lies on the demand side. Increasing numbers of people have been buying bitcoin, not because they want to use it for transactions, whether legitimate or illegal over the dark web, but because they want to invest in bitcoin. In other words, they want to hold bitcoin as an asset which is increasing in value. These people are known as ‘hodlers’ – a deliberate misspelling of ‘holders’.
But this speculation is of the destabilising form. The more prices have risen, the more people have bought bitcoin, thus pushing the price up further. This is a classic bubble, whereby the price does not reflect an underlying value, but rather the exuberance of buyers.
 The problem with bubbles is that they will burst, but just when is virtually impossible to predict with any accuracy. If the price of bitcoins falls, what will happen next depends on how the fall is interpreted. It could be interpreted as a temporary fall, caused by some people cashing in to take advantage of the higher prices. At the same time, other people, believing that it is only a temporary fall, will rush to buy, snapping up bitcoins at the temporary low price. This ‘stabilising speculation’ will move the price back up again.
However, the fall in price may be seen as the bubble bursting, with even bigger falls ahead. In this case, people will rush to sell before it falls further, thereby pushing the price even lower. This destabilising speculation will amplify the fall in prices.
But even if the bubble does burst, people may believe that another bubble will then occur and, once they think the bottom has been reached, will thus start buying again and there will be a second speculative rise in the price.
The crash could be very short-lived. This happened with the second biggest cryptocurrency, Ethereum. On 21 June this year, the price at the beginning of the day was $360. It then began to fall during the say. Once its price reached $315, it then collapsed by 96% to $13 with massive selling, much of it automatic with computers programmed to sell when the price falls by more than a certain amount. But then, on the same day, it rebounded. Within minutes it had bounced back and was trading at $337 at the end of the day. It is now trading at around $450 – up from around $300 four weeks ago.
Whether the bubble in bitcoin has more to inflate, when it will burst, and when it will rebound and by how much, depends on people’s expectations. But what we are looking at here is people’s expectations of what other people are likely to do – in other words, of other people’s expectations, which in turn depend on their expectations of other people’s expectations. This situation is known as a Keynesian Beauty Contest (see the blog, A stock market beauty contest of the machines). Perhaps we need a crystal ball.
Information site
Articles
- Is Bitcoin a bubble? Here’s what two bubble experts told us
Trade Online, Timothy B. Lee (8/12/17)
- Bitcoin and tulipmania have a lot more in common than you might think
Business Insider, Seth Archer (8/12/17)
- Bitcoin ends dramatic week with 20% slump followed by recovery
The Guardian, Jill Treanor (8/12/17)
- Putting a price on Bitcoin
The Economist, Buttonwood’s notebook (8/12/17)
- Is Bitcoin a Bubble Waiting to Pop?
InvestorPlace, Matt McCall (8/12/17)
- Bitcoin bubble follows classic pattern of investment mania
Financial Times, John Authers (8/12/17)
- The Bitcoin bubble – how we know it will burst
The Conversation, Larisa Yarovaya and Brian Lucey (6/12/17)
- Bitcoin isn’t a currency – and unless it becomes one it could be worthless
The Conversation, Vili Lehdonvirta (6/12/17)
- How Bitcoin futures trading could burst the cryptocurrency’s bubble
The Conversation, Nafis Alam (13/12/17)
- Op-ed: Bitcoin Is Not a Bubble; It’s in an S-Curve and It’s Just Getting Started
Bitcoin Magazine, Brandon Green (8/12/17)
- Bitcoin vs history’s biggest bubbles: They never end well
CNN Money, Daniel Shane (8/12/17)
- The 10 Most Ridiculous Price Bubbles In History
Business Insider, Vincent Fernando and Anika Anand (11/10/10)
- After bitcoin’s wild week, traders brace for futures launch
Reuters, Saqib Iqbal Ahmed (10/12/17)
Cryptocurrencies current market prices
Questions
- To what extent does Bitcoin meet the functions of money?
- Why is bitcoin unsuitable for normal transactions?
- To what extent is bitcoin like gold as a means of holding wealth?
- How would you advise someone thinking of buying bitcoin today? Explain why.
- Does a rapid rise in the price of an asset always indicate a bubble? Explain
- To what extent is the current rise in the price of bitcoin similar to that of the tulip, Poseidon and Beanie Baby bubbles?
- If bitcoin is appreciating relative to the dollar and other currencies, does this mean that the price of goods and services valued in bitcoin are falling? Explain.
- Explain and comment on the following sentence from the first Conversation article: “Like any asset, Bitcoin has some fundamental value, even if only a hope value, or a value arising from scarcity.”
- How might the introduction of futures trading in bitcoin impact on its price and the volatility of price swings?
- Explain and assess the argument that the price trend of bitcoin is more likely to be an S curve rather than a roller coaster