With first Houston, then several Caribbean islands and Florida suffering dreadful flooding and destruction from Hurricanes Harvey and Irma, many are questioning whether more should be spent on flood prevention and reducing greenhouse gas emissions. Economists would normally argue that such questions are answered by conducting a cost–benefit analysis.
However, even if the size of the costs and benefits of such policies could be measured, this would not be enough to give the answer. Whether such spending is justified would depend on the social rate of discount. But what the rate should be in cost-benefit analyses is a highly contested issue, especially when the benefits occur a long time in the future.
I you ask the question today, ‘should more have been spent on flood prevention in Houston and Miami?’, the answer would almost certainly be yes, even if the decision had to have been taken many years ago, given the time it takes to plan and construct such defences.  But if you asked people, say, 15 years ago whether such expenditure should be undertaken, many would have said no, given that the protection would be provided quite a long time in the future. Also many people back then would doubt that the defences would be necessary and many would not be planning to live there indefinitely.
This is the familiar problem of people valuing costs and benefits in the future less than costs and benefits occurring today. To account for this, costs and benefits in the future are discounted by an annual rate to reduce them to a present value.
But with costs and benefits occurring a long time in the future, especially from measures to reduce carbon emissions, the present value is very sensitive to the rate of discount chosen. But choosing the rate of discount is fraught with difficulties.
Some argue that a social rate of discount should be similar to long-term market rates. But market rates reflect only the current generation’s private preferences. They do not reflect the costs and benefits to future generations. A social rate of discount that did take their interests into account would be much lower and could even be argued to be zero – or negative with a growing population.
Against this, however, has to be set the possibility that future generations will be richer than the current one and will therefore value a dollar (or any other currency) less than today’s generation.
 However, it is also likely, if the trend of recent decades is to continue, that economic growth will be largely confined to the rich and that the poor will be little better off, if at all. And it is the poor who often suffer the most from natural disasters. Just look, for example, at the much higher personal devastation suffered from hurricane Irma by the poor on many Caribbean islands compared with those in comparatively wealthy Florida.
A low or zero discount rate would make many environmental projects socially profitable, even though they would not be with a higher rate. The choice of rate is thus crucial to the welfare of future generations who are likely to bear the brunt of climate change.
But just how should the social rate of discount be chosen? The following two articles explore the issue.
Articles
How Much Is the Future Worth? Slate, Will Oremus (1/9/17)
Climate changes the debate: The impact of demographics on long-term discount rates Vox, Eli P Fenichel, Matthew Kotchen and Ethan T Addicott (20/8/17)
Questions
- What is meant by the social rate of discount?
- Why does the choice of a lower rate of social discount imply a more aggressive climate policy?
- How is the distribution of the benefits and costs of measures to reduce carbon emissions between rich and poor relevant in choosing the social rate of discount of such measures?
- How is the distribution of the benefits of such measures between current and future generations relevant in choosing the rate?
- How is uncertainty about the magnitude of the costs and benefits relevant in choosing the rate?
- What is the difference between Stern’s and Nordhaus’ analyses of the choice of social discount rate?
- Explain and discuss the ‘mortality-based approach’ to estimating social discount rates.
- What are the arguments ‘for economists analysing climate change through the lens of minimising risk, rather than maximizing utility’?
 Many politicians throughout the world,
not just on the centre and left, are arguing for increased spending on infrastructure. This was one of the key proposals of Donald Trump during his election campaign. In his election manifesto he pledged to “Transform America’s crumbling infrastructure into a golden opportunity for accelerated economic growth and more rapid productivity gains”.
Increased spending on inffrastructure has both demand- and supply-side effects.
Unless matched by cuts elsewhere, such spending will increase aggregate demand and could have a high multiplier effect if most of the inputs are domestic. Also there could be accelerator effects as the projects may stimulate private investment.
On the supply side, well-targeted infrastructure spending can directly increase productivity and cut costs of logistics and communications.
The combination of the demand- and supply-side effects could increase both potential and actual output and reduce unemployment.
 So, if infrastructure projects can have such beneficial effects, why are politicians often so reluctant to give them the go-ahead?
Part of the problem is one of timing. The costs occur in the short run. These include demolition, construction and disruption. The direct benefits occur in the longer term, once the project is complete. And for complex projects this may be many years hence. It is true that demand-side benefits start to occur once construction has begun, but these benefits are widely dispersed and not easy to identify directly with the project.
Then there is the problem of externalities. The external costs of projects may include environmental costs and costs to local residents. This can lead to protests, public hearings and the need for detailed cost–benefit analysis. This can delay or even prevent projects from occurring.
The external benefits are to non-users of the project, such as a new bridge or bypass reducing congestion for users of existing routes. These make the private construction of many projects unprofitable, except with public subsidies or with public–private partnerships. So there does need to be a macroeconomic policy that favours publicly-funded infrastructure projects.
One type of investment that is less disruptive and can have shorter-term benefits is maintenance investment. Maintenance expenditure can avoid much more costly rebuilding expenditure later on. But this is often the first type of expenditure to be cut when public-sector budgets as squeezed, whether at the local or national level.
The problem of lack of infrastructure investment is very much a political problem. The politicians who give the go-ahead to such projects, such as high-speed rail, come in for criticisms from those bearing the short-run costs but they are gone from office once the benefits start to occur. They get the criticism but not the praise.
Articles
Are big infrastructure projects castles in the air or bridges to nowhere? The Economist, Buttonwood’s notebook (16/1/17)
Trump’s plans to rebuild America are misguided and harmful. This is how we should do it. The Washington Post, Lawrence H. Summers (17/1/17)
Questions
- Identify the types of externality from (a) a new high-speed rail line, (b) new hospitals.
- How is discounting relevant to decisions about public-sector projects?
- Why are governments often unwilling to undertake (a) new infrastructure projects, (b) maintenance projects?
- Is a programme of infrastructure investment necessarily a Keynesian policy?
- What accelerator effects would you expect from infrastructure investment?
- Explain the difference between the ‘spill-out’ and ‘pull-in’ effects of different types of public investments in a specific location. Is it possible for a project to have both effects?
- What answer would you give to the teacher who asked the following question of US Treasury Secretary, Larry Summers? “The paint is chipping off the walls of this school, not off the walls at McDonald’s or the movie theatre. So why should the kids believe this society thinks their education is the most important thing?”
- What is the ‘bridge to nowhere’ problem? Why does it occur and what are the solutions to it?
- Why is the ‘castles in the air’ element of private projects during a boom an example of the fallacy of composition?
 Australia held a general election on 2 July 2016. The Liberal/National coalition narrowly won in the House of Representatives, gaining a substantially reduced majority of 77 of the 150 seats, to Labor’s 68 and other parties’ 5 seats. One campaign issue for all parties was the destruction of the Great Barrier Reef, which is seen as an environmental disaster. Each party had proposals for tackling the problem and we examine some of them here.
The Great Barrier Reef is the largest coral reef in the world. As the BBC’s iWonder guide states:
One of the world’s seven natural wonders, the Great Barrier Reef contains some 900 islands and 3000 smaller reefs. It is larger than the UK, the Netherlands and Switzerland combined, home to around 10% of the world’s marine fish, over 200 bird species and countless other animals, including turtles and dolphins.
But this iconic Reef system is facing unprecedented threats. Together with governments, scientists are playing a key role in the battle to preserve this vulnerable ecosystem before it’s too late.
The Reef is 2300km long. In the northern third, around half of the coral is dead. Few tourists see this, as they tend to dive in the southern third, which, being cooler, is less affected.
The bleaching and destruction of coral reefs has a number of causes. These include: rising water temperatures, generally from global warming and more extreme El Niño events (rising warm waters that periodically spread across the Pacific); pollution, including that from coal mining, industrial effluent and run-off of pesticides, herbicides, fertilisers and sediment from farming, leading to acidification of waters; more frequent and more violent cyclones; rapidly expanding numbers of coral-eating Crown of Thorns starfish; and over fishing of some species of fish, leading to knock-on effects on ecosystems.
 The Barrier Reef and the oceans and atmosphere around it can be regarded as a common resource. The warming of the atmosphere and the oceans, and the destruction of the reef and the wildlife on it, are examples of the ‘tragedy of the commons’. With no-one owning these resources, they are likely to be overused and abused. Put another way, these activities cause negative externalities, which do not appear as costs to the polluters and despoilers, but are still costs to all who treasure the reef. And, from a non-human perspective, it is a cost to the planet and its biodiversity. What is in the private interests of the abusers is not in the social or environmental interest.
The Australian government had sought to downplay the extent of the problem, afraid of deterring tourists – a valuable source of revenue – and under pressure from the coal and farming industries. Nevertheless, in the run-up to the election, the destruction of the Reef and what to do about it became a major debating point between the parties.
 The Coalition government has pledged A$1bn for a new Reef fund, which will be dedicated to tackling climate change and water quality.
The fund will also help coastal sewage treatment plants to reduce ocean outfalls with efficient pumps, biogas electricity generation and next-generation waste water treatment. Improving water quality will enhance the Reef’s resilience to climate change, coral bleaching and outbreaks of the destructive crown of thorns starfish.
But how much difference the fund can make with the money it will have is not clear.
The Labor Party pledged to follow every recommendation in the Great Barrier Reef Water Science Taskforce’s Final Report, released in May, and to pass laws to prevent farm pollution flowing into the waters around the Reef and to have a more rapid shift towards renewable energy.
The Green Party goes the furthest. In addition to the Labor Party’s proposals, it wants to impose taxes on coal firms equal to the cost of the damage they are causing. The tax revenues would be paid into a multi-billion dollar fund. This would then be spent on measures to rescue the Reef, invest in clean energy projects, stop damaging industrial development, improve farm management and stop polluted run-off into the Reef catchment area by investing in water systems.
Promises at the time of an election are all well and good. Just how much will be done by the re-elected Coalition government remains to be seen.
Interactive Videos and presentations
 David Attenborough’s Great Barrier Reef: an Interactive Journey, Atlantic Productions, David Attenborough (2015)
Global Warming – the greatest market failure Prezi, Yvonne Cheng (5/12/12)
Articles
The Great Barrier Reef: a catastrophe laid bare The Guardian, Michael Slezak (7/6/16)
The Guardian view on the Great Barrier Reef: the crisis they prefer to downplay The Guardian (7/6/16)
Fight to save Great Barrier Reef could cost billions, secret government modelling estimates ABC News, Mark Willacy (2/6/16)
Great Barrier Reef: government must choose which parts to save, says expert The Guardian, Joshua Robertson (8/7/16)
This election, what hope is there for the Great Barrier Reef? The Guardian, Michael Slezak (1/7/16)
Coalition will protect Great Barrier Reef with $1bn fund, says PM The Guardian, Gareth Hutchens (12/6/16)
Great Barrier Reef election explainer: how do the parties compare? The Guardian, Michael Slezak (2/6/16)
Five things we can do right now to save the Great Barrier Reef The Guardian, John Pandolfi (13/6/16)
We’ve scored the parties on the Reef My Sunshine Coast, Australian Marine Conservation Society (29/6/16)
Our Most Iconic Places Are Under Dire Threat From Climate Change Huffington Post, Nick Visser (26/5/16)
There are bright spots among the world’s coral reefs – the challenge is to learn from them The Conversation, Australia, Joshua Cinner (21/7/16)
Questions
- Explain what is meant by the Tragedy of the Commons. Is all pollution damage an example of this?
- What can the Australian government do to internalise the external costs to the Great Barrier Reef from (a) farming; (b) mining; (c) global warming?
- Why is it difficult to reach international agreement on tackling climte change? What insights can game theory provide for understanding the difficulties?
- What are the recommendations in the Final Report of the Great Barrier Reef Water Science Taskforce? What mix of tools does it suggest?
- What are the relative advantages and disadvantages of taxation, laws and regulations, public investment, education and international negotiation as policy instruments to protect the Reef?
 Concerns have been expressed about the UK’s relatively poor record of upgrading broadband services so that households can receive ultrafast connectivity. Some commenters have argued that future economic growth prospects will be harmed if the UK continues to lag behind its leading rivals.
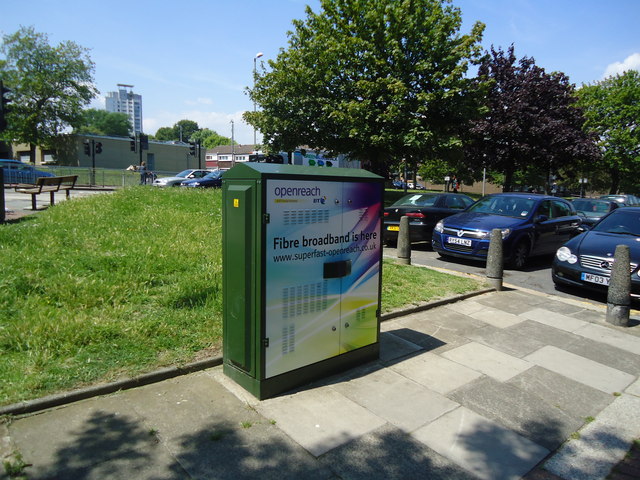
Much of the fixed line system that allows people to connect to broadband was originally installed many years ago for the land-line telephone network. The so called ‘final mile’ consists of copper-based wiring that is carried from street cabinets to the premises of the end-user. This wiring is transported via a huge network of telegraph poles and cable ducts (small underground tunnels).
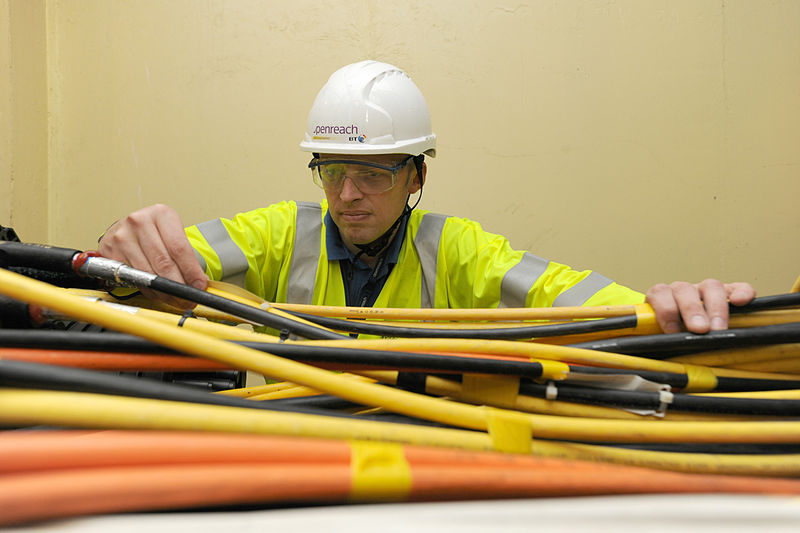
In order for people to gain connectivity to ultrafast broadband this copper based wiring needs to be replaced by fibre optic cables. This is commonly referred to as Fibre to the Premises (FTTP). Unfortunately, the UK has a relatively poor record of installing FTTP. Japan and Korea were forecast to have 70% and 63% coverage by the end of 2015 as opposed to just 2% in the UK.
Why is the UK’s record so poor? Many observers blame it on the structure of the industry. In other network industries, such as those for gas pipeline and electricity grids, the business responsible for managing the infrastructure, National Grid, is a regulated monopoly. This company does not directly supply services to consumers using the network it is responsible for maintaining. Instead, customers are supplied by the retail sector of the industry, where firms compete for their business. This sector includes the so-called ‘big six’ (British Gas; npower; SSE; Scottish Power; EDF; E.On) and a number of smaller suppliers such as Ovo Energy and Ebico.

The structure of the fixed line telecommunications sector is very different. The company that manages the ‘final mile’, Openreach, is a subsidiary of BT. BT also competes with other Internet Service Providers (ISPs), such as TalkTalk and Sky, to supply broadband to customers using this network. Its market share of 32 per cent makes it the largest player in the broadband market. Sky and TalkTalk have market shares of 22 per cent and 14 per cent respectively. Virgin Media also supplies 20 per cent of this market using its own network of ducts and cables.
Given that in most cases ISPs such as Sky and TalkTalk are stuck with the network Openreach provides, BT may have limited incentives to invest. It can still earn a good return from its infrastructure of copper-based wiring and avoid installing expensive FTTP. Dido Harding, the chief executive of TalkTalk, argued that:
“We need to separate Openreach from the rest of BT to create a more competitive, pro-investment market”
Ofcom, in its recent review of the market, has taken a different approach. Rather than creating an entirely separate monopoly business to manage the network (i.e. splitting Openreach from BT), the regulator instead opted for a policy of encouraging competition between different suppliers that deploy fibre optic cables. It states in the report that:
“We believe competition between different networks is the best way to drive investment in high-quality, innovative services for customers.”
This competition could come from ISPs such as TalkTalk and Sky or other smaller network providers such as CityFibre and Gigaclear.
One major problem with this approach is that potential new entrants might be deterred from entering the market because of the very high initial costs involved in building a new network in order to deploy FTTP. In particular, the costs of digging up the roads and laying the ducts are considerable. Matt Yardley, author of a study on the industry, said:
“It is widely accepted that civil works such as digging trenches account for up to 80% of broadband deployment costs.”
One way of reducing these costs and encouraging more competition is to allow rival firms access to the existing ducts and poles that are currently managed by Openreach. Once access has been obtained, these firms could effectively rent space inside the ducts and lay fibre optic cables alongside the existing copper-based wiring. Vodafone reported that a similar policy in Spain had reduced its capital expenditure of building FTTP by 40 per cent compared with constructing its own network of ducts and poles.
Ofcom first introduced this type of policy in 2010 when it launched its Physical Infrastructure Access (PIA) initiative. Unfortunately it has proved to be relatively unsuccessful with very little demand for PIA from rival firms. The success of this type of policy will depend on a number of factors including (1) the prices charged by Openreach to access and rent space inside the ducts; (2) the simplicity of any relevant administration; and (3) the availability and reliability of information about the ducts. With this last point, key issues include:
|
|
| • |
Where they are located . |
| • |
How much space is available: i.e. is there enough space for firms to lay fibre optic cables alongside the existing wiring? |
| • |
What condition they are in: i.e. are they flooded or clogged up with sand and mud, which will involve expensive work to make them usable again?
|
Firms did complain about the pricing structures and bureaucratic nature of the administration process under the PIA scheme. However, their most significant concerns were about the uncertainty that was created by the lack of information about the ducts and poles. For example, analysts from the consultancy firm, Reburn, argued that if a firm contacted Openreach to try to obtain access to the network it was informed that:
“We don’t know what condition the ducts and poles are in. Please pay £10 000 for a survey. Also unfortunately we are rather busy and we can only start in six weeks.”
Matthew Hare, the chief executive of Gigaclear, argued that it was like going to a shop where the assistant says:
“Give me some money, and I’ll tell you whether you can have it or not.”
In response to these criticisms Ofcom has introduced a number of changes to PIA, which has been re-named Duct and Pole Access (DPA). In particular, it has imposed a new requirement on Openreach to create a database that provides information on the location, condition and capacity of its ducts and poles. The database must be made available to rival ISPs and network providers. DPA must also be provided on the same timescales, terms and conditions to all businesses including other parts of BT – this is referred to as ‘equivalence of inputs’.
The first big test of this policy is in Southend where City Fibre is hoping to deploy 50km of fibre optic cables using DPA. However, reports in the media have suggested that the initial surveys have found very limited capacity in some of the ducts, which would make DPA impossible.
It will be interesting to see how the trial in Southend progresses. If it is successful, then DPA may be viable for about 40 per cent of premises in the UK. If it fails, then Ofcom might ultimately have to force Openreach to be completely separated from BT.
Articles
How the gothic city of York became a broadband battleground The Telegraph, Kate Palmer (22/5/16)
City Fibre first to mount BT challenge after Openreach is told to share network The Telegraph, Kate Palmer (1/3/16)
Challenges as CityFibre Moot Using BT Cable Ducts in Southend-on-Sea ISPreview, Mark Jackson (2/5/16)
CityFibre to build pure fibre infrastructure for Southend Networking (5/4/16)
Ofcom tells BT to open up infrastructure to rivals The Guardian, Rob Davies (26/2/16)
Questions
- Draw an average total cost curve to illustrate the economics of building a network of ducts and poles. Label the minimum efficient scale.
- To what extent does DPA create a contestable market?
- For DPA to deliver productive efficiency, what must be true about the economies of scale of laying fibre optic cables?
- In the run-up to Ofcom’s review of the telecoms industry, many commentators described Openreach as being a natural monopoly. To what extent do you agree with this argument?
- What are the advantages of marginal cost pricing? What issues might a regulator face if it tried to impose marginal cost pricing on a natural monopoly?
- Using a diagram, explain how the network of ducts and poles might be a natural monopoly in rural areas but not in densely populated urban areas.
- Discuss how Ofcom has tried to increase the level of separation between Openreach and BT.
 The government plans to improve broadband access across the country and BT is a key company within this agenda. However, one of the problems with BT concerns its natural monopoly over the cable network and the fact that this restricts competition and hence might prevent the planned improvements.
Ofcom, the communications watchdog has now said that BT must open up its cable network, making it easier for other companies to access. This will allow companies such as Sky, Vodafone and TalkTalk to invest in the internet network in the UK, addressing their criticisms that BT has under-invested in Openreach and this is preventing universal access to decent and affordable broadband. There have been calls for Ofcom to require BT and Openreach to separate, but Ofcom’s report hasn’t required this, though has noted that it ‘remains an option’.
BT has been criticised as relying on old cables that are not sufficient to provide the superfast broadband that the government wants. The report may come as a relief to BT who had perhaps expected that Ofcom might require it to sell its Openreach operation, but it will also remain concerned about Ofcom’s constant monitoring in the years to come. BT commented:
“Openreach is already one of the most heavily regulated businesses in the world but we have volunteered to accept tighter regulation … We are happy to let other companies use our ducts and poles if they are genuinely keen to invest very large sums as we have done.”
 Its rivals will also be in two minds about the report, happy that some action will be taken, but wanting more, as Ofcom’s report suggests that “Openreach still has an incentive to make decisions in the interests of BT, rather than BT’s competitors”. A spokesperson for Vodafone said:
“BT still remains a monopoly provider with a regulated business running at a 28% profit margin …We urge Ofcom to ensure BT reinvests the £4bn in excess profits Openreach has generated over the last decade in bringing fibre to millions of premises across the country, and not just make half-promises to spend an unsubstantiated amount on more old copper cable.”
The impact of Ofcom’s report on the competitiveness of this market will be seen over the coming years and with a freer market, we might expect prices to come down and see improved broadband coverage across the UK. In order to achieve the government’s objective with regards to broadband coverage, a significant investment is needed in the network. With BT having to relinquish its monopoly power and the market becoming more competitive, this may be the first step towards universal access to superfast broadband. The following articles consider this report and its implications.
Ofcom opens a road to faster broadband The Guardian, Harriet Meyer and Rob Davies (28/2/16)
Ofcom: BT must open up its Openreach network Sky News (25/2/16)
How Ofcom’s review of BT Openreach could improve your internet service Independent, Doug Bolton (25/2/16)
Ofcom’s digital review boosts faltering broadband network Financial Times, Daniel Thomas (25/2/16)
The Observer view on broadband speeds in Britain The Observer, Editorial (28/2/16)
Ofcom tells BT to open up cable network to rivals’ BBC News (25/2/16)
Ofcom should go further and break up BT Financial Times, John Gapper (25/2/16)
BT escapes forced Openreach spin-off but Ofcom tightens regulations International Business Times, Bauke Schram (25/2/16)
Questions
- Why does BT have a monopoly and how might this affect the price, output and profits in this market?
- Ofcom’s report suggests that the market must be opened up and this would increase competitiveness. How is this expected to work?
- What are the benefits and costs of using regulation in a case such as this, as opposed to some other form of intervention?
- How might a more competitive market increase investment in this market?
- If the market does become more competitive, what be the likely consequences for consumers and firms?
 With first Houston, then several Caribbean islands and Florida suffering dreadful flooding and destruction from Hurricanes Harvey and Irma, many are questioning whether more should be spent on flood prevention and reducing greenhouse gas emissions. Economists would normally argue that such questions are answered by conducting a cost–benefit analysis.
 But if you asked people, say, 15 years ago whether such expenditure should be undertaken, many would have said no, given that the protection would be provided quite a long time in the future. Also many people back then would doubt that the defences would be necessary and many would not be planning to live there indefinitely.
 However, it is also likely, if the trend of recent decades is to continue, that economic growth will be largely confined to the rich and that the poor will be little better off, if at all. And it is the poor who often suffer the most from natural disasters. Just look, for example, at the much higher personal devastation suffered from hurricane Irma by the poor on many Caribbean islands compared with those in comparatively wealthy Florida.