It is impossible to make both precise and accurate forecasts of a country’s rate of economic growth, even a year ahead. And the same goes for other macroeconomic variables, such as the rate of unemployment or the balance of trade. The reason is that there are so many determinants of these variables, such as political decisions or events, which themselves are unpredictable. Economics examines the effects of human interactions – it is a social science, not a natural science. And human behaviour is hard to forecast.
Leading indicators
Nevertheless, economists do make forecasts. These are best estimates, taking into account a number of determinants that can be currently measured, such as tax or interest rate changes. These determinants, or ‘leading indicators’, have been found to be related to future outcomes. For example, surveys of consumer and business confidence give a good indication of future consumer expenditure and investment – key components of GDP.
Leading indicators do not have to be directly causal. They could, instead, be a symptom of underlying changes that are themselves likely to affect the economy in the future. For example, changes in stock market prices may reflect changes in confidence or changes in liquidity. It is these changes that are likely to have a direct or indirect causal effect on future output, employment, prices, etc.
Macroeconomic models show the relationships between variables. They show how changes in one variable (e.g. increased investment) affect other variables (e.g. real GDP or productivity). So when an indicator changes, such as a rise in interest rates, economists use these models to estimate the likely effect, assuming other things remain constant (ceteris paribus). The problem is that other things don’t remain constant. The economy is buffeted around by a huge range of events that can affect the outcome of the change in the indicator or the variable(s) it reflects.
Forecasting can never therefore be 100% accurate (except by chance). Nevertheless, by carefully studying leading indicators, economists can get a good idea of the likely course of the economy.
Leading indicators of the US economy
At the start of 2019, several leading indicators are suggesting the US economy is likely to slow and might even go into recession. The following are some of the main examples.
Political events. This is the most obvious leading indicator. If decisions are made that are likely to have an adverse effect on growth, a recession may follow. For example, decisions in the UK Parliament over Brexit will directly impact on UK growth.
As far as the USA is concerned, President Trump’s decision to put tariffs on steel and aluminium imports from a range of countries, including China, the EU and Canada, led these countries to retaliate with tariffs on US imports. A tariff war has a negative effect on growth. It is a negative sum game. Of course, there may be a settlement, with countries agreeing to reduce or eliminate these new tariffs, but the danger is that the trade war may continue long enough to do serious damage to global economic growth.
But just how damaging it is likely to be is impossible to predict. That depends on future political decisions, not just those of the recent past. Will there be a global rise in protectionism or will countries pull back from such a destructive scenario? On 29 December, President Trump tweeted, ‘Just had a long and very good call with President Xi of China. Deal is moving along very well. If made, it will be very comprehensive, covering all subjects, areas and points of dispute. Big progress being made!’ China said that it was willing to work with the USA over reaching a consensus on trade.
Rises in interest rates. If these are in response to a situation of excess demand, they can be seen as a means of bringing inflation down to the target level or of closing a positive output gap, where real national income is above its potential level. They would not signify an impending recession. But many commentators have interpreted rises in interest rates in the USA as being different from this.
The Fed is keen to raise interest rates above the historic low rates that were seen as an ’emergency’ response to the financial crisis of 2007–8. It is also keen to reverse the policy of quantitative easing and has begun what might be described as ‘quantitative tightening’: not buying new bonds when existing ones that it purchased during rounds of QE mature. It refers to this interest rate and money supply policy as ‘policy normalization‘. The Fed maintains that such policy is ‘consistent with sustained expansion of economic activity, strong labor market conditions, and inflation near the Committee’s symmetric 2 percent objective over the medium term’.
However, many commentators, including President Trump, have accused the Fed of going too fast in this process and of excessively dampening the economy. It has already raised the Federal Funds Rate nine times by 0.25 percentage points each time since December 2015 (click here for a PowerPoint file of the chart). What is more, announcing that the policy will continue makes such announcements themselves a leading indicator of future rises in interest rates, which are a leading indicator of subsequent effects on aggregate demand. The Fed has stated that it expects to make two more 0.25 percentage point rises during 2019.
Surveys of consumer and business confidence. These are some of the most significant leading indicators as consumer confidence affects consumer spending and business confidence affects investment. According to the Duke CFO Global Business Outlook, an influential survey of Chief Financial Officers, ‘Nearly half (48.6 per cent) of US CFOs believe that the US will be in recession by the end of 2019, and 82 per cent believe that a recession will have begun by the end of 2020’. Such surveys can become self-fulfilling, as a reported decline in confidence can itself undermine confidence as both firms and consumers ‘catch’ the mood of pessimism.
Stock market volatility. When stock markets exhibit large falls and rises, this is often a symptom of uncertainty; and uncertainty can undermine investment. Stock market volatility can thus be a leading indicator of an impending recession. One indicator of such volatility is the VIX index. This is a measure of ’30-day expected volatility of the US stock market, derived from real-time, mid-quote prices of S&P 500® Index (SPXSM) call and put options. On a global basis, it is one of the most recognized measures of volatility – widely reported by financial media and closely followed by a variety of market participants as a daily market indicator.’ The higher the index, the greater the volatility. Since 2004, it has averaged 18.4; from 17 to 28 December 2018, it averaged 28.8. From 13 to 24 December, the DOW Jones Industrial Average share index fell by 11.4 per cent, only to rise by 6.2 per cent by 27 December. On 26 December, the S&P 500 index rallied 5 per cent, its best gain since March 2009.
Not all cases of market volatility, however, signify an impending recession, but high levels of volatility are one more sign of investor nervousness.
Oil prices. When oil prices fall, this can be explained by changes on the demand and/or supply side of the oil market. Oil prices have fallen significantly over the past two months. Until October 2018, oil prices had been rising, with Brent Crude reaching $86 per barrel by early October. By the end of the year the price had fallen to just over $50 per barrel – a fall of 41 per cent. (Click here for a PowerPoint file of the chart.) Part of the explanation is a rise in supply, with shale oil production increasing and also increased output from Russia and Saudi Arabia, despite a commitment by the two countries to reduce supply. But the main reason is a fall in demand. This reflects both a fall in current demand and in anticipated future demand, with fears of oversupply causing oil companies to run down stocks.
Falling oil prices resulting from falling demand are thus an indicator of lack of confidence in the growth of future demand – a leading indicator of a slowing economy.
The yield curve. This depicts the yields on government debt with different lengths to maturity at a given point in time. Generally, the curve slopes upwards, showing higher rates of return on bonds with longer to maturity. This is illustrated by the blue line in the chart. (Click here for a PowerPoint file of the chart.) This is as you would expect, with people requiring a higher rate of return on long-term lending, where there is normally greater uncertainty. But, as the Bloomberg article, ‘Don’t take your eyes off the yield curve‘ states:
Occasionally, the curve flips, with yields on short-term debt exceeding those on longer bonds. That’s normally a sign investors believe economic growth will slow and interest rates will eventually fall. Research by the Federal Reserve Bank of San Francisco has shown that an inversion has preceded every US recession for the past 60 years.
The US economy is 37 quarters into what may prove to be its longest expansion on record. Analysts surveyed by Bloomberg expect gross domestic product growth to come in at 2.9 percent this year, up from 2.2 percent last year. Wages are rising as unfilled vacancies hover near all-time highs.
With times this good, the biggest betting game on Wall Street is when they’ll go bad. Barclays Plc, Goldman Sachs Group Inc., and other banks are predicting inversion will happen sometime in 2019. The conventional wisdom: Afterward it’s only a matter of time – anywhere from 6 to 24 months – before a recession starts.
As you can see from the chart, the yield curve on 24 December 2018 was still slightly upward sloping (expect between 6-month and 1-year bonds) – but possibly ready to ‘flip’.
However, despite the power of an ‘inverted’ yield in predicting previous recessions, it may be less reliable now. The Fed, as we saw above, has already signalled that it expects to increase short-term rates in 2019, probably at least twice. That alone could make the yield curve flatter or even downward sloping. Nevertheless, it is still generally thought that a downward sloping yield curve would signal belief in a likely slowdown, if not outright recession.
So, is the USA heading for recession?
The trouble with indicators is that they suggest what is likely – not what will definitely happen. Governments and central banks are powerful agents. If they believed that a recession was likely, then fiscal and monetary policy could be adjusted. For example, the Fed could halt its interest rate rises and quantitative tightening, or even reverse them. Also, worries about protectionism may subside if the USA strikes new trade deals with various countries, as it did with Canada and Mexico in USMCA.
Are periods of above-trend expansion necessarily followed by a recession?
Give some examples of leading indicators other than those given above and discuss their likely reliability in predicting a recession.
Find out what has been happening to confidence levels in the EU over the past 12 months. Does this provide evidence of an impending recession in the EU?
For what reasons may there be lags between a change in an indicator and a change in the variables for which it is an indicator?
Why has the shape of the yield curve previously been a good predictor of the future course of the economy? Is it likely to be at present?
What is the relationship between interest rates, government bond prices (‘Treasuries’ in the USA) and the yield on such bonds?
Would you start a family if you were pessimistic about the future of the economy? Buckles et al (2017) (see link below) believe that fewer of us would do so and, therefore, fertility rates could be used by investors and central banks as an early signal to pick up subtle changes in consumer confidence and overall economic climate.
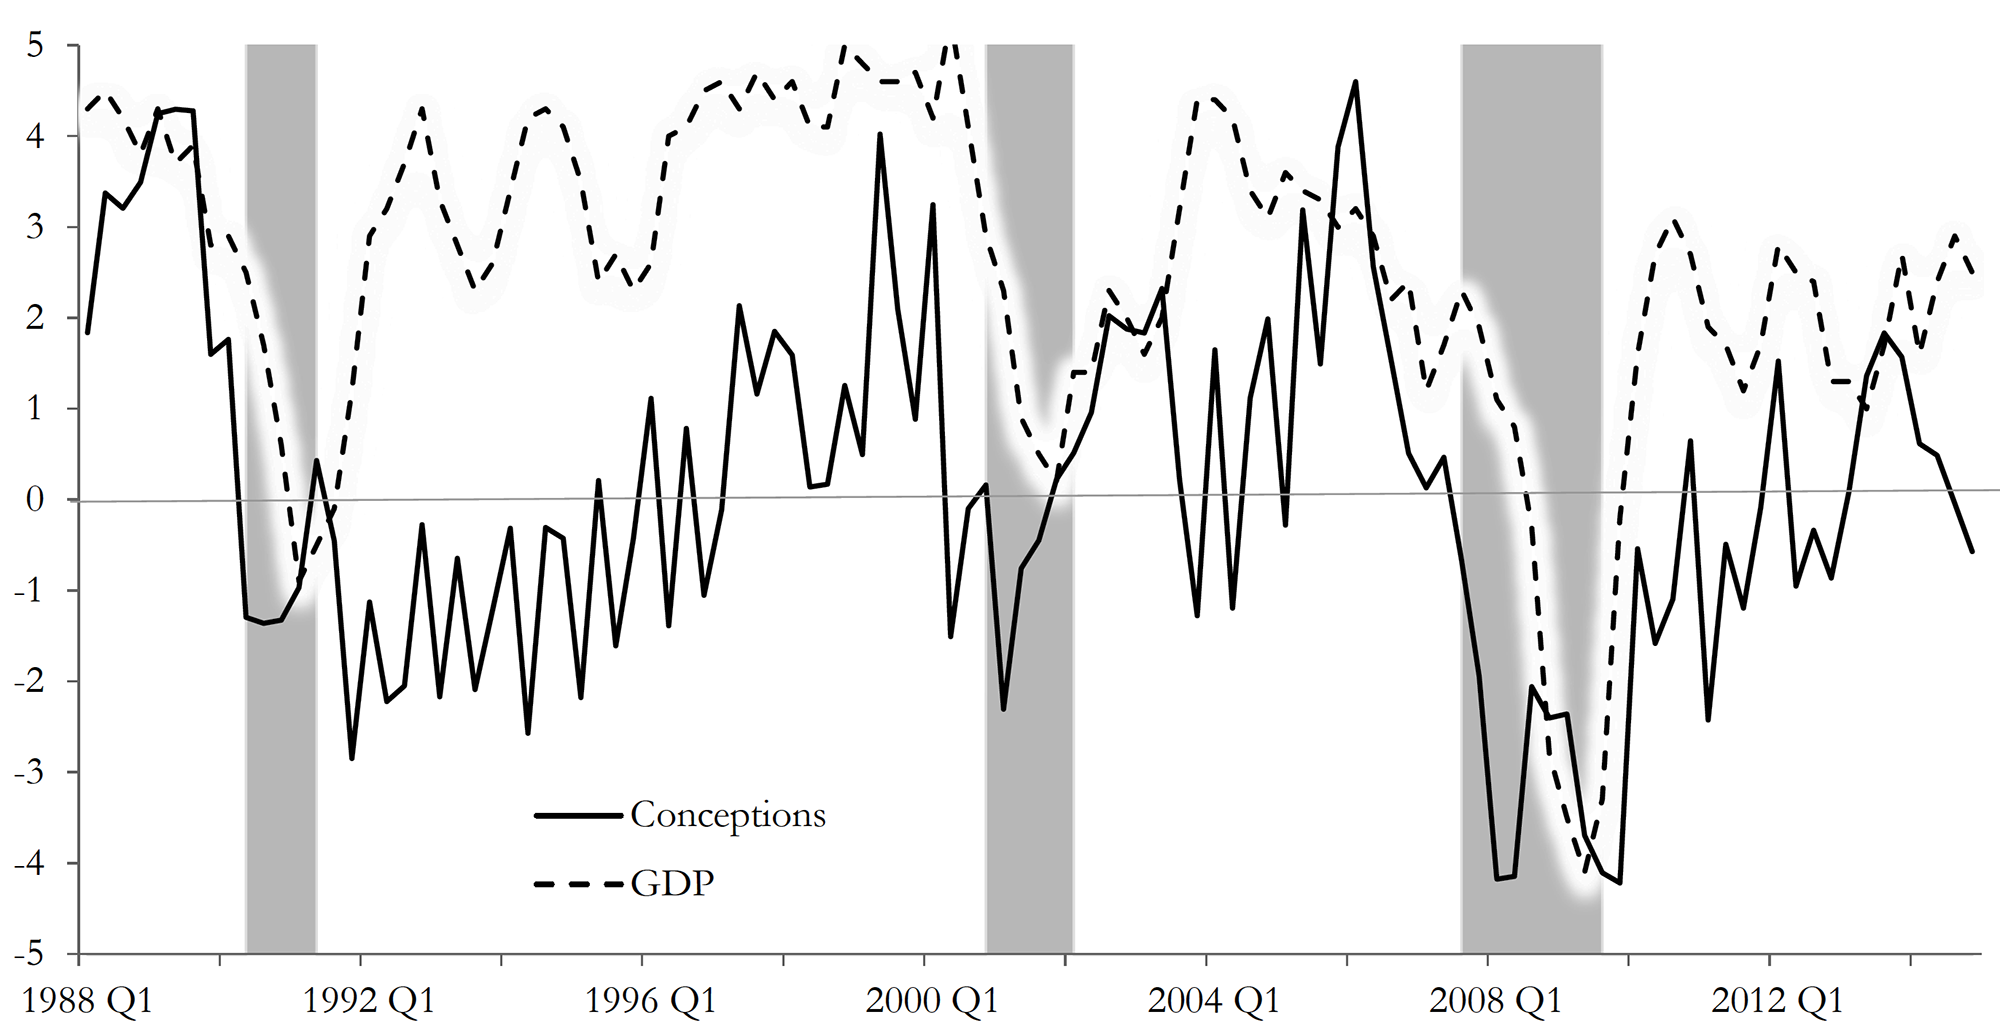
Their study titled ‘Fertility is a leading economic indicator’ uses ‘live births’ data, sourced from US birth certificates, to explore if there is any association between fertility changes (measured as the rate of change in number of births) and GDP growth. Their results suggest that, in the case of the USA, there is: dips in fertility rates tend to precede by several quarters slowdown in economic activity. As the authors state:
The growth rate of conceptions declines prior to economic downturns and the decline occurs several quarters before recessions begin. Our measure of conceptions is constructed using live births; we present evidence suggesting that our results are indeed driven by changes in conceptions and not by changes in abortion or miscarriage. Conceptions compare well with or even outperform other economic indicators in anticipating recessions.
Conception and GDP Growth Rates (source Buckles et al p33: see below)
Although this is not the first piece of academic writing to claim that fertility has pro-cyclical qualities (see for instance, Adsera (2004, 2011), Adsera and Menendez (2011), Currie and Schwandt (2014) and Chatterjee and Vogle (2016) linked below), it is, to the best of our knowledge, the most recent paper (in terms of data used) to depict this relationship and to explore the suitability of fertility as a macroeconomic indicator to predict recessions.
Economies, after all, are groups of people who participate actively in day-to-day production and consumption activities – as consumers, workers and business leaders. Changes in their environment should affect their expectations about the future.
Are people, however, forward-looking enough to guide their current behaviours by their expectations of future economic outcomes? They may be, according to the findings of this study.
Did you know, for instance, that sales of ties tend to increase in economic downturns, as men buy more ties to show that they are working harder, in fear of losing their job[1]? But this is probably a topic for another blog.
Give two reasons why fertility rates may be a good indicator of economic activity.
Give two reasons why fertility rates may NOT be a good indicator of economic activity.
Do a literature search to identify and explain an ‘unorthodox’ macroeconomic indicator of your choice, and how it has been used to track economic activity.
In three interesting articles, linked below, the authors consider the state of economies since the financial crisis of 2007–8 and whether governments have the right tools to tackle future economic shocks.
There have been some successes over the past 10 years, in particular keeping inflation close to central bank targets despite considerable shocks (see the Vox article). Also unemployment has fallen in most countries and to very low levels in some, including the UK.
But economic growth has generally remained well below the levels prior to the financial crisis, with low productivity growth being the main culprit. Indeed, many people have seen no growth at all in their real incomes over the past 10 years, with low unemployment being bought at the cost of a growth in zero-hour contracts and work in the gig economy. And what economic growth we have seen has been largely the result of taking up slack through unprecedentedly loose monetary policy.
Fiscal policy, except in the period directly following the financial crisis, has generally been tight as governments have sought to reduce their deficits and slow down the growth in their debt.
But what will happen if economies once more slow? Or, worse still, what will happen if there is another global recession? Do countries have the policies to tackle the problem this time round?
Quantitative easing could be used again, but many economists believe that it will have more limited scope if confined to the purchase of assets in the secondary market. Also, there is little scope for reducing interest rates, which, despite some modest rises in the USA, remain at close to zero in most developed countries.
One possibility is a combination of monetary and fiscal policy, where new money is used to finance government expenditure on infrastructure, such as road and rail, broadband, green energy, hospitals and schools and colleges. This would avoid the need for governments to borrow on open markets as the spending would be financed by new government securities purchased directly by the central bank.
An objection to such ‘people’s quantitative easing‘, as it has been dubbed, is that it would effectively end the independence of central banks. This independence has been credited by many with giving central banks credibility in controlling inflation. Would inflationary expectations rise with people’s quantitative easing and, with it, actual inflation? A lot would depend on the extent to which this QE could still be conducted within a framework of targeting inflation and whether people’s expectations of inflation could be managed jointly by the government and central bank.
Why, during the next recession, will the “zero lower bound” (ZLB) on interest rates almost certainly bite again?
Why would the scope for QE, as conducted up to now, be more limited in the future if a recession were to occur?
Why have central banks appeared to have been so successful in keeping inflation close to target despite negative and positive demand- and supply-side shocks?
Why are the pressures on government expenditure likely to increase in the coming years?
How would a temporary price-level target help to tackle a recession when the economy next bumps into the ZLB? What would limit its success?
Is it appropriate for central banks to stick to an inflation target in times when there is an adverse supply-side shock resulting in cost-push inflation?
Why might monetary policy conducted in a framework of inflation targeting tend to lessen the impact of a fiscal stimulus?
What are the arguments for and against relaxing central bank independence and pursuing a co-ordinated fiscal and monetary policy?
What are the arguments for and against using helicopter money to boost private expenditure during a future recession where interest rates are already near the ZLB?
What are the arguments for and against using ‘people’s QE’?
The article below looks at the economy of Brazil. The statistics do not look good. Real output fell last year by 3.8% and this year it is expected to fall by another 3.3%. Inflation this year is expected to be 9.0% and unemployment 11.2%, with the government deficit expected to be 10.4% of GDP.
The article considers Keynesian economics in the light of the case of Brazil, which is suffering from declining potential supply, but excess demand. It compares Brazil with the case of most developed countries in the aftermath of the financial crisis. Here countries have suffered from a lack of demand, made worse by austerity policies, and only helped by expansionary monetary policy. But the effect of the monetary policy has generally been weak, as much of the extra money has been used to purchase assets rather than funding a growth in aggregate demand.
Different policy prescriptions are proposed in the article. For developed countries struggling to grow, the solution would seem to be expansionary fiscal policy, made easy to fund by lower interest rates. For Brazil, by contrast, the solution proposed is one of austerity. Fiscal policy should be tightened. As the article states:
Spending restraint might well prove painful for some members of Brazilian society. But hyperinflation and default are hardly a walk in the park for those struggling to get by. Generally speaking, austerity has been a misguided policy approach in recent years. But Brazil is a special case. For now, anyway.
The tight fiscal policies could be accompanied by supply-side policies aimed at reducing bureaucracy and inefficiency.
The UK has voted to leave the EU by 17 410 742 votes (51.9% or 37.4% of the electorate) to 16 141 241 votes (48.1% or 34.7% of the electorate). But what will be the economic consequences of the vote?
To leave the EU, Article 50 must be invoked, which starts the process of negotiating the new relationship with the EU. This, according to David Cameron, will happen when a new Conservative Prime Minister is chosen. Once Article 50 has been invoked, negotiations must be completed within two years and then the remaining 27 countries will decide on the new terms on which the UK can trade with the EU. As explained in the blog, The UK’s EU referendum: the economic arguments, there are various forms the new arrangements could take. These include:
‘The Norwegian model’, where Britain leaves the EU, but joins the European Economic Area, giving access to the single market, but removing regulation in some key areas, such as fisheries and home affairs. Another possibility is ‘the Swiss model’, where the UK would negotiate trade deals on an individual basis. Another would be ‘the Turkish model’ where the UK forms a customs union with the EU. At the extreme, the UK could make a complete break from the EU and simply use its membership of the WTO to make trade agreements.
The long-term economic effects would thus depend on which model is adopted. In the Norwegian model, the UK would remain in the single market, which would involve free trade with the EU, the free movement of labour between the UK and member states and contributions to the EU budget. The UK would no longer have a vote in the EU on its future direction. Such an outcome is unlikely, however, given that a central argument of the Leave camp has been for the UK to be able to control migration and not to have to pay contributions to the EU budget.
It is quite likely, then, that the UK would trade with the EU on the basis of individual trade deals. This could involve tariffs on exports to the EU and would involve being subject to EU regulations. Such negotiations could be protracted and potentially extend beyond the two-year deadline under Article 50. But for this to happen, there would have to be agreement by the remaining 27 EU countries. At the end of the two-year process, when the UK exits the EU, any unresolved negotiations would default to the terms for other countries outside the EU. EU treaties would cease to apply to the UK.
It is quite likely, then, that the UK would face trade restrictions on its exports to the EU, which would adversely affect firms for whom the EU is a significant market. Where practical, some firms may thus choose to relocate from the UK to the EU or move business and staff from UK offices to offices within the EU. This is particularly relevant to the financial services sector. As the second Economist article explains:
In the longer run … Britain’s financial industry could face severe difficulties. It thrives on the EU’s ‘passport’ rules, under which banks, asset managers and other financial firms in one member state may serve customers in the other 27 without setting up local operations. …
Unless passports are renewed or replaced, they will lapse when Britain leaves. A deal is imaginable: the EU may deem Britain’s regulations as ‘equivalent’ to its own. But agreement may not come easily. French and German politicians, keen to bolster their own financial centres and facing elections next year, may drive a hard bargain. No other non-member has full passport rights.
But if long-term economic effects are hard to predict, short-term effects are happening already.
The pound fell sharply as soon as the results of the referendum became clear. By the end of the day it had depreciated by 7.7% against the dollar and 5.7% against the euro. A lower pound will make imports more expensive and hence will drive up prices and reduce the real value of sterling. On the other had, it will make exports cheaper and act as a boost to exports.
If inflation rises, then the Bank of England may raise interest rates. This could have a dampening effect on the economy, which in turn would reduce tax revenues. The government, if it sticks to its fiscal target of achieving a public-sector net surplus by 2020 (the Fiscal Mandate), may then feel the need to cut government expenditure and/or raise taxes. Indeed, the Chancellor argued before the vote that such an austerity budget may be necessary following a vote to leave.
Higher interest rates could also dampen house prices as mortgages became more expensive or harder to obtain. The exception could be the top end of the market where a large proportion are buyers from outside the UK whose demand would be boosted by the depreciation of sterling.
But given that the Bank of England’s remit is to target inflation in 24 month’s time, it is possible that any spike in inflation is temporary and this may give the Bank of England leeway to cut Bank Rate from 0.5% to 0.25% or even 0% and/or to engage in further quantitative easing.
One major worry is that uncertainty may discourage investment by domestic companies. It could also discourage inward investment, and international companies many divert investment to the EU. Already some multinationals have indicated that they will do just this. Shares in banks plummeted when the results of the vote were announced.
Uncertainty is also likely to discourage consumption of durables and other big-ticket items. The fall in aggregate demand could result in recession, again necessitating an austerity budget if the Fiscal Mandate is to be adhered to.
We live in ‘interesting’ times. Uncertainty is rarely good for an economy. But that uncertainty could persist for some time.
What are the main elements of a balance of payments account? Changes in which elements caused the depreciation of the pound following the Brexit vote? What elements of the account, in turn, are likely to be affected by the depreciation?
What determines the size of the effect on the current account of the balance of payments of a depreciation? How might long-term effects differ from short-term ones?
Is it possible for firms to have access to the single market without allowing free movement of labour?
What assumptions were made by the Leave side about the economic effects of Brexit?
Would it be beneficial to go for a ‘free trade’ option of abolishing all import tariffs if the UK left the EU? Would it mean that UK exports would face no tariffs from other countries?
What factors are likely to drive the level of investment in the UK (a) by domestic companies trading within the UK and (b) by multinational companies over the coming months?
What will determine the course of monetary policy over the coming months?
 It is impossible to make both precise and accurate forecasts of a country’s rate of economic growth, even a year ahead. And the same goes for other macroeconomic variables, such as the rate of unemployment or the balance of trade. The reason is that there are so many determinants of these variables, such as political decisions or events, which themselves are unpredictable. Economics examines the effects of human interactions – it is a social science, not a natural science. And human behaviour is hard to forecast.
 As far as the USA is concerned, President Trump’s decision to put tariffs on steel and aluminium imports from a range of countries, including China, the EU and Canada, led these countries to retaliate with tariffs on US imports. A tariff war has a negative effect on growth. It is a negative sum game. Of course, there may be a settlement, with countries agreeing to reduce or eliminate these new tariffs, but the danger is that the trade war may continue long enough to do serious damage to global economic growth.
  However, many commentators, including President Trump, have accused the Fed of going too fast in this process and of excessively dampening the economy. It has already raised the Federal Funds Rate nine times by 0.25 percentage points each time since December 2015 (click here for a PowerPoint file of the chart). What is more, announcing that the policy will continue makes such announcements themselves a leading indicator of future rises in interest rates, which are a leading indicator of subsequent effects on aggregate demand. The Fed has stated that it expects to make two more 0.25 percentage point rises during 2019.
 Surveys of consumer and business confidence. These are some of the most significant leading indicators as consumer confidence affects consumer spending and business confidence affects investment. According to the Duke CFO Global Business Outlook, an influential survey of Chief Financial Officers, ‘Nearly half (48.6 per cent) of US CFOs believe that the US will be in recession by the end of 2019, and 82 per cent believe that a recession will have begun by the end of 2020’. Such surveys can become self-fulfilling, as a reported decline in confidence can itself undermine confidence as both firms and consumers ‘catch’ the mood of pessimism.
 Oil prices. When oil prices fall, this can be explained by changes on the demand and/or supply side of the oil market. Oil prices have fallen significantly over the past two months. Until October 2018, oil prices had been rising, with Brent Crude reaching $86 per barrel by early October. By the end of the year the price had fallen to just over $50 per barrel – a fall of 41 per cent. (Click here for a PowerPoint file of the chart.) Part of the explanation is a rise in supply, with shale oil production increasing and also increased output from Russia and Saudi Arabia, despite a commitment by the two countries to reduce supply. But the main reason is a fall in demand. This reflects both a fall in current demand and in anticipated future demand, with fears of oversupply causing oil companies to run down stocks.
  The yield curve. This depicts the yields on government debt with different lengths to maturity at a given point in time. Generally, the curve slopes upwards, showing higher rates of return on bonds with longer to maturity. This is illustrated by the blue line in the chart. (Click here for a PowerPoint file of the chart.) This is as you would expect, with people requiring a higher rate of return on long-term lending, where there is normally greater uncertainty. But, as the Bloomberg article, ‘Don’t take your eyes off the yield curve‘ states: