 Firms are increasingly having to take into account the interests of a wide range of stakeholders, such as consumers, workers, the local community and society in general (see the blog, Evolving Economics). However, with many firms, the key stakeholders that influence decisions are shareholders. And because many shareholders are footloose and not committed to any one company, their main interests are short-term profit and share value. This leads to under-investment and too little innovation. It has also led to excessive pay for senior executives, which for many years has grown substantially faster than the pay of their employees. Indeed, executive pay in the UK is now, per pound of turnover, the highest in the world.
So is there an alternative model of capitalism, which better serves the interests of a wider range of stakeholders? One model is that of employee ownership. Perhaps the most famous example of this is the John Lewis Partnership, which owns both the department stores and the Waitrose chain of supermarkets. As the partnership’s site claims, ‘when you’re part of it, you put your heart into it’. Although the John Lewis Partnership is the largest in the UK, there are over 330 employee-owned businesses across the UK, with over 200 000 employee owners contributing some £30bn per year to UK GDP. Again, to quote the John Lewis site:
Businesses range from manufacturers, to community health services, to insurance brokers. Together they deliver 4% of UK GDP annually, with this contribution growing. They are united by an ethos that puts people first, involving the workforce in key decision-making and realising the potential and commitment of their employees.
A recent example of a company moving, at least partly, in this direction is BT, which has announced that that every one of its 100 000 employees will get shares worth £500 every year. Employees will need to hold their shares for at least three years before they can sell them. The aim is to motivate staff and help the company achieve a turnaround from its recent lacklustre performance, which had resulted in its laying off 13 000 of its 100 000-strong workforce.
 Another recent example of a company adopting employee ownership is Richer Sounds, the retail TV and hi-fi chain. Its owner and founder, Julian Richer, announced that he had transferred 60% of his shares into a John Lewis-style trust for the chain’s 531 employees. In addition to owning 60% of the company, employees will receive £1000 for every year they have worked for the retailer. A new advisory council, made up of current staff, will advise the management board, which is taking over the running of the firm from Richer.
According to the Employee Ownership Association (EOA), a further 50 businesses are preparing to follow suit and adopt forms of employee ownership. As The Conversation article linked below states:
As a form of stakeholder capitalism, the evidence shows that employee ownership boosts employee commitment and motivation, which leads to greater innovation and productivity.
Indeed, a study of employee ownership models in the US published in April found it narrowed gender and racial wealth gaps. Surveying 200 employees from 21 companies with employee ownership plans, Joseph Blasi and his colleagues at Rutgers University found employees had significantly more wealth than the average US worker.
The researchers also found that the participatory management practices that accompanied the employee ownership schemes led to employees improving their communication skills and learning management skills, which had helped them make better financial decisions at home.
But, although employee ownership brings benefits, not only to the employees themselves, but also more widely to society, there is no simple mechanism for achieving it when shareholders are unlikely to want to relinquish their shares. Employee buyout schemes require funding; and banks are often cautious about providing such funding. What is more, there needs to be an employee trust overseeing the running of the company which takes a long-term perspective and not just that of current employees, who might otherwise be tempted to sell the company to another seeking to take it over.
Articles
Report
Questions
- What are the main benefits of employee ownership?
- Are there any disadvantages of employee ownership and, if so, what are they?
- What are the main barriers to the adoption of employee ownership?
- What are the main recommendations from The Ownership Effect Inquiry? (See linked report above.)
- What are the findings of the responses to the employee share ownership questions in the US General Social Survey (GSS)? (See linked Global Banking & Finance Review article above.)
 It’s been a while since I last blogged about labour markets and, in particular, about the effect of automation on wages and employment. My most recent post on this topic was on the 14th of April 2018 and it was mostly a reflection on some interesting findings that had been reported by Acemoglu et al (2017). More specifically, Acemoglu and Restrepo (2017) developed a theoretical framework to evaluate the effect of AI on employment and wages. They concluded that the effect was negative and potentially sizeable (for a more detailed discussion see my blog).
Using a model in which robots compete against human labor in the production of different tasks, we show that robots may reduce employment and wages … According to our estimates, one more robot per thousand workers reduces the employment to population ratio by about 0.18–0.34 percentage points and wages by 0.25–0.5 percent.
Since then, I have seen a constant stream of news on my news feed about the development of ever more advanced industrial robots and artificial intelligence. And this was not because of some spooky coincidence (or worse). It has been merely a reflection of the speed at which technology has been progressing in this field.
There are now robots that can run, jump, hold conversations with humans, do gymnastics (and even sweat for it!) and more. It is really impressive how fast change has been happening recently in this field – and, unsurprisingly, it has stimulated the interest of labour economists!
A paper that has recently come to my attention on this subject is by Graetz and Michaels (2018). The authors put together a panel dataset on robot adoption within seventeen countries from 1993 to 2007 and use advanced econometric techniques to evaluate the effect of these technologies on employment and productivity growth. Their analysis focuses exclusively on developed economies (due to data limitations, as they explain) – but their results are nevertheless intriguing:
We study here for the first time the relationship between industrial robots and economic outcomes across much of the developed world. Using a panel of industries in seventeen countries from 1993 to 2007, we find that increased use of industrial robots is associated with increases in labor productivity. We find that the contribution of increased use of robots to productivity growth is substantial and calculate using conservative estimates that it comes to 0.36 percentage points, accounting for 15% of the aggregate economy-wide productivity growth.
The pattern that we document is robust to including various controls for country trends and changes in the composition of labor and other capital inputs. We also find that robot densification is associated with increases in both total factor productivity and wages, and reductions in output prices. We find no significant relationship between the increased use of industrial robots and overall employment, although we find that robots may be reducing the employment of low-skilled workers.
This is very positive news for most – except, of course, for low-skilled workers. Indeed, like Acemoglu and Restrepo (2017) and many others, this study shows that the effect of automation on employment and labour market outcomes is unlikely to be uniform across all types of workers. Low-skilled workers are found again to be likely to lose out and be significantly displaced by these technologies.
And if you are wondering which sectors are likely to be disrupted most/first by automation, the rankings developed by McKinsey and Company (see chart below) would give you an idea of where the disruption is likely to start. Unsurprisingly, the sectors that seem to be the most vulnerable, are the ones that use the highest share of low-skilled labour.

Articles
Questions
- “The effect of automation on wages and employment is likely to be positive overall”. Discuss.
- Using examples and anecdotal evidence, do you agree with these findings?
- Using Google Scholar, put together a list of 5 recent (i.e. 2015 or later) articles and working papers on labour markets and automation. Compare and discuss their findings.
 When did you last think about buying a new car? If not recently, then you may be in for a surprise next time you shop around for car deals. First, you will realise that the range of hybrid cars (i.e. cars that combine conventional combustion and electric engines) has widened significantly. The days when you only had a choice of Toyota Prius and another two or three hybrids are long gone! A quick search on the web returned 10 different models (although five of them belong to the Toyota Prius family), including Chevrolet Malibu, VW Jetta and Ford Fusion. And these are only the cars that are currently available in the UK market.
But the biggest surprise of all may be the number of purely (plug-) electric cars that are available to UK buyers these days. The table below provides a summary of total registrations of light-duty plug-electric cars by model in the UK, between 2010 and June 2016.
Source: Wikipedia, “Plug-in electric vehicles in the United Kingdom”
In 2010 there were nly 138 electric vehicles in total registered in the UK. They were indeed an unusual sight at that time – and good luck to you if you had one and you happened to run out of power in the middle of a journey. In 2011 this (small) number increased sevenfold – an increase that was driven mostly by the successful introduction of Nissan Leaf (635 electric Nissans were registered in the UK that year). And since then the number of electric vehicles registered in the country has increased with spectacular speed, at an average rate of 252% per year.
There is clearly strong interest in electric vehicles – an interest likely to increase as their price becomes more competitive. However, they are still very expensive items to buy, especially when compared with their conventional fuel-engine counterparts. What makes electric cars expensive? One thing is the cost of purchasing and maintaining a battery that can deliver a reasonable range. But the cost of batteries is falling, as more and more companies realise the potential of this new market and join the R&D race. As mentioned in a special report that was published recently in the FT:
The cost of lithium-ion batteries has fallen by 75 per cent over the past eight years, measured per kilowatt hour of output. Every time battery production doubles, costs fall by another 5 per cent to 8 per cent, according to analysts at Wood Mackenzie.
There is no doubt that more research will result in more efficient batteries, and will increase the interest in electric cars not only by consumers but also by producers, who already see the opportunity of this new global market.  Does this mean that prices will necessarily fall further? You might think so, but then you have to take into consideration the availability and cost of mining further raw materials to make these batteries (such as cobalt, which is one of the materials used in the making of lithium-ion batteries and nearly half of which is currently sourced from the Democratic Republic of Congo). This may lead to bottlenecks in the production of new battery units. In which case, the price of batteries (and, by extension, the price of electric cars) may not fall much further until some new innovation happens that changes either the material or its efficiency.
The good news is that a lot of researchers are currently looking into these questions, and innovation will do what it always does: give solutions to problems that previously appeared insurmountable. They had better be fast because, according to estimates by Wood Mackenzie, the number of electric vehicles globally is expected to rise by over 50 times – from 2 million (in 2017) to over 125 million by 2035.
How many economists does it take to charge an electric car? I guess we are going to find out!
Articles
Information
Questions
- Using a demand and supply diagram, explain the relationship between the price of a battery and the market (equilibrium) price of a plug-in electric vehicle.
- List all non-price factors that influence demand for plug-in electric vehicles. Briefly explain each.
- Should the government subsidise the development and production of electric car batteries? Explain the advantages and disadvantages of such intervention and take a position.
 So here we are, summer is over (or almost over if you’re an optimist) and we are sitting in front of our screens reminiscing about hot sunny days (at least I do)! There is no doubt, however: a lot happened in the world of politics and economics in the past three months. The escalation of the US-China trade war, the run on the Turkish lira, the (successful?) conclusion of the Greek bailout – these are all examples of major economic developments that took place during the summer months, and which we will be sure to discuss in some detail in future blogs. Today, however, I will introduce a topic that I am very interested in as a researcher: the liberalisation of energy markets in developing countries and, in particular, Mexico.
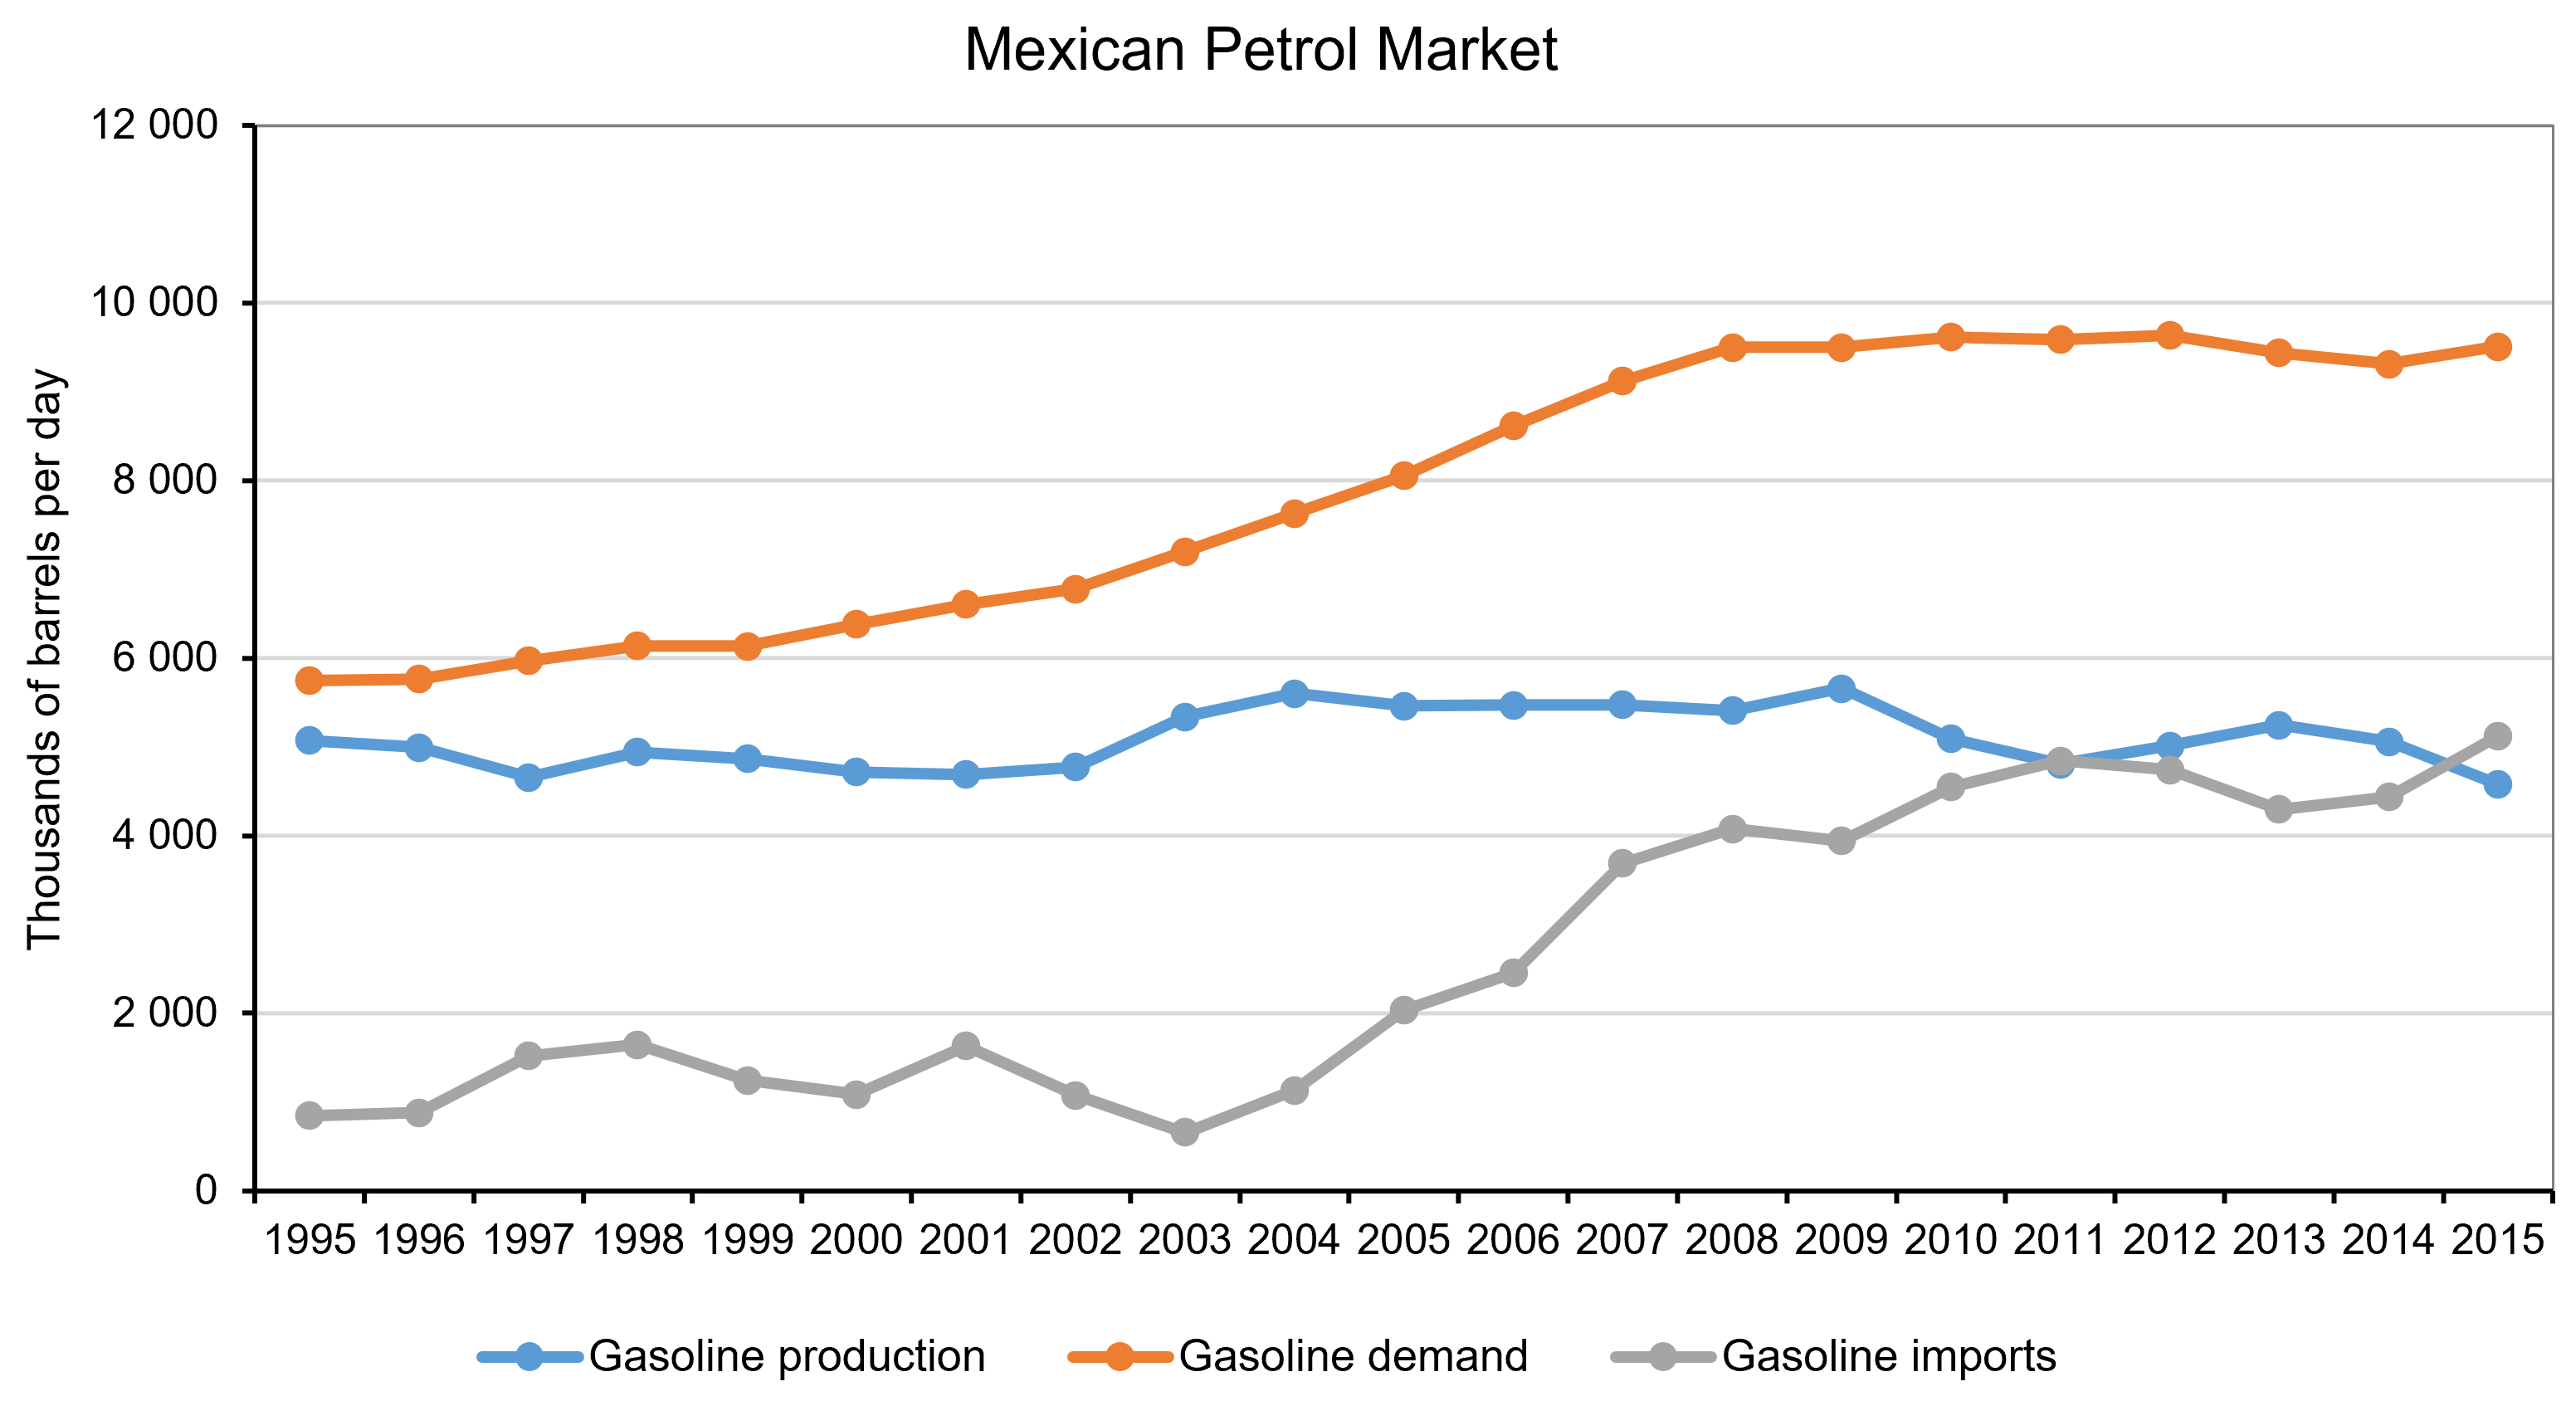
Why Mexico? Well, because it is a great example of a large developing economy that has been attempting to liberalise its energy market and reverse price setting and monopolistic practices that go back several decades. Until very recently, the price of petrol in Mexico was set and controlled by Pemex, a state monopolist. This put Pemex under pressure since, as a sole operator, it was responsible for balancing growing demand and costs, even to the detriment of its own finances.
The petrol (or ‘gasoline’) price liberalisation started in May 2017 and took place in stages – starting in the North part of Mexico and ending in November of the same year in the central and southern regions of the country. The main objective was to address the notable decrease in domestic oil production that put at risk the ability of the country to meet demand; as well as Mexico’s increasing dependency on foreign markets affected by the surge of the international oil price. The government has spent the past five years trying to create a stronger regulatory framework, while easing the financial burden on the state and halting the decline in oil reserves and production. Unsurprisingly, opening up a monopolistic market turns out to be a complex and bumpy process.
 Source: Author’s calculations using data from the Energy Information Bank, Ministry of Energy, Mexico
Despite all the reforms, retail petrol prices have kept rising. Although part of this price rise is demand-driven, an increasing number of researchers highlight the significance of the distribution of oil-related infrastructure in determining price outcomes at the federal and regional (state) level. Saturation and scarcity of both distribution and storage infrastructure are probably the two most significant impediments to opening the sector up to competition (Mexico Institute, 2018). You see, the original design of these networks and the deployment of the infrastructure was not aimed at maximising efficiency of distribution – the price was set by the monopolist and, in a way that was compliant with government policy (Mexico Institute, 2018). Economic efficiency was not always part of this equation. As a result, consumers located in better-deployed areas were subsidising the inherent logistics costs of less ‘well endowed’ regions by facing an artificially higher price than they would have in a competitive market.
But what about now? Do such differences in the allocation of infrastructure between regions lead to location-related differences in the price of petrol? If so, by how much? And, what policies should the government pursue to address such imbalances? These are all questions that I explore in one of my recent working papers titled ‘Widening the Gap: Lessons from the aftermath of the energy market reform in Mexico’ (with Hugo Vallarta) and I will be sharing some of the answers with you in a future blog.
Articles
Data
Questions
- Are state-owned monopolies effective in delivering successful market outcomes? Why yes, why no?
- In the case of Mexico, are you surprised about the complexities that were involved with opening up markets to competition? Explain why.
- Use Google to identify countries in which energy markets are controlled by state-owned monopolies.
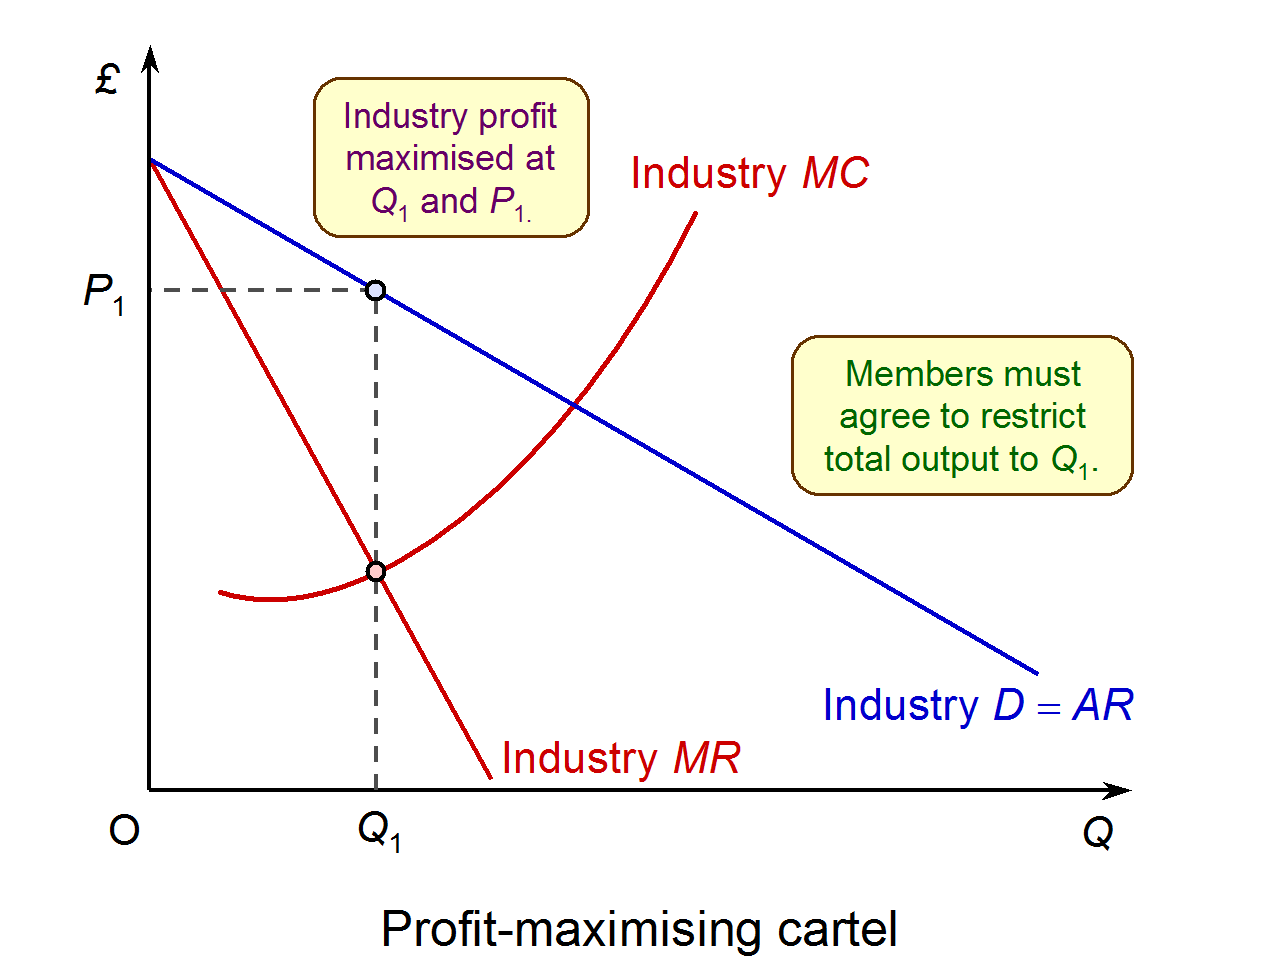 Price fixing agreements between firms are one of the most serious breaches of competition law. Therefore, if detected, the firms involved face substantial fines (see here for an example), plus there is also the potential for jail sentences and director disqualification for participants. However, due to their secretive nature and the need for hard evidence of communication between firms, it is difficult for competition authorities to detect cartel activity.
In order to assist detection, competition authorities offer leniency programmes that guarantee full immunity from fines to the first participant to come forward and blow the whistle on the cartel. This has become a key way in which competition authorities detect cartels. Recently, competition authorities have introduced a number of new tools to try to enhance cartel detection.
 First, the European Commission launched an online tool to make it easier for cartels to be reported to them. This tool allows anonymous two-way communication in the form of text messages between a whistle blower and the Commission. The Commissioner in charge of competition policy, Margrethe Vestager, stated that:
If people are concerned by business practices that they think are wrong, they can help put things right. Inside knowledge can be a powerful tool to help the Commission uncover cartels and other anti-competitive practices. With our new tool it is possible to provide information, while maintaining anonymity. Information can contribute to the success of our investigations quickly and more efficiently to the benefit of consumers and the EU’s economy as a whole.
 Second, the UK Competition and Markets Authority (CMA) has launched an online and social media campaign to raise awareness of what is illegal under competition law and to encourage illegal activity to be reported to them. The CMA stated that:
Cartels are both harmful and illegal, and the consequences of breaking the law are extremely serious. That is why we are launching this campaign – to help people understand what cartel activity looks like and how to report it so we can take action.
This campaign is on the back of the CMA’s own research which found that less that 25% of the businesses they surveyed believed that they knew competition law well. Furthermore, the CMA is now offering a reward of up to £100,000 and guaranteed anonymity to individuals who provide them with information.
It will be fascinating to see the extent to which these new tools are used and whether they aid the competition authorities in detecting and prosecuting cartel behaviour.
Articles
CMA launches crackdown on cartels as illegal activity rises The Telegraph, Bradley Gerrard (20/03/17)
European Commission launches new anonymous whistleblower tool, but who would use it? Competition Policy Blog, Andreas Stephan (21/03/17)
CMA launches campaign to crackdown on cartels Insider Media Limited, Karishma Patel (21/03/17)
Questions
- Why do you think leniency programmes are a key way in which competition authorities detect cartels?
- Who do you think is most likely to blow the whistle on a cartel (see the article above by A.Stephan)?
- Why is it worrying that so few businesses appear to know competition law well?
- Which of the two tools do you think is most likely to enhance cartel detection? Explain why.