The latest consumer confidence figures from the European Commission point to consumer confidence in the UK remaining at around its long-term average. Despite this, confidence is markedly weaker than before the outcome of the EU referendum. Yet, the saving ratio, which captures the proportion of disposable income saved by the household sector, is close to its historic low. We consider this apparent puzzle and whether we can expect the saving ratio to rise.
The European Commission’s consumer confidence measure is a composite indicator based on the balance of responses to 4 forward-looking questions relating to the financial situation of households, the general economic situation, unemployment expectations and savings.
 Chart 1 shows the consumer confidence indicator for the UK. The long-term average (median) of –6.25 shows that negative responses across the four questions typically outweigh positive responses. In October 2018 the confidence balance stood at –5.2, essentially unchanged from its September value of –5.8. While above the long-term average, recent values mark a weakening in confidence from levels before the EU referendum. At the beginning of 2016 the aggregate confidence score was running at around +4. (Click here to download a PowerPoint of the chart.)
Chart 1 shows two periods where consumer confidence fell markedly. The first was in the early 1990s. In 1990 the UK joined the Exchange Rate Mechanism (ERM). This was a semi-fixed exchange rate system whereby participating EU countries allowed fluctuations against each other’s currencies, but only within agreed bands, while being able to collectively float freely against all other currencies. In attempting to staying in the ERM, the UK was obliged to raise interest rates in order to protect the pound. The hikes to rates contributed to a significant dampening of aggregate demand and the economy slid into recession. Britain crashed out of the ERM in September 1992.
The second period of declining confidence was during the global financial crisis in the late 2000s. The retrenchment among financial institutions meant a significant tightening of credit conditions. This too contributed to a significant dampening of aggregate demand and the economy slid into recession. Whereas the 1992 recession saw the UK national output contract by 2.0 percent, this time national output fell by 6.3 per cent.
The collapses in confidence from 1992 and from 2007/08 are likely to have helped propagate the effects of the fall in aggregate demand that were already underway. The weakening of confidence in 2016 is perhaps a better example of a ‘confidence shock’, i.e. a change in aggregate demand originating from a change in confidence. Nonetheless, a fall in confidence, whether it amplifies existing shocks or is the source of the shock, is often taken as a signal of greater economic uncertainty. If we take this greater uncertainty to reflect a greater range of future income outcomes, including potential income losses, then households may look to insure themselves by increasing current saving.
It is usual to assume that people suffer from diminishing marginal utility of total consumption. This means that while total satisfaction increases as we consume more, the additional utility from consuming more (marginal utility) decreases. An implication of this is that a given loss of consumption reduces utility by more than an equivalent increase in consumption increases utility. This explains why people prefer more consistent consumption levels over time and so engage in consumption smoothing. The utility, for example, from an ‘average’ consumption level across two time periods, is higher, than the expected utility from a ‘low’ level of consumption in period 1 and a ‘high’ level of consumption in period 2. This is because the loss of utility from a ‘low’ level of consumption relative to the ‘average’ level is greater than the additional utility from the ‘high’ level relative to the ‘average’ level.
If greater uncertainty, such as that following the EU referendum, increases the range of possible ‘lower’ consumption values in the future even when matched by an increase in the equivalent range of possible ‘higher’ consumption values, then expected future utility falls. The incentive therefore is for people to build up a larger buffer stock of saving to minimise utility losses if the ‘bad state’ occurs. Hence, saving which acts as a from of self-insurance in the presence of uncertainty is known as buffer-stock saving or precautionary saving.
 Chart 2 plots the paths of the UK household-sector saving ratio and consumer confidence. The saving ratio approximates the proportion of disposable income saved by the household sector. What we might expect to see if more uncertainty induces buffer-stock saving is for falls in confidence to lead to a rise in the saving ratio. Conversely, less uncertainty as proxied by a rise in confidence would lead to a fall in the saving ratio. (Click here to download a PowerPoint of the chart.)
The chart provides some evidence that of this. The early 1990s and late 2000s certainly coincided with both waning confidence and a rising saving ratio. The saving ratio rose to as high as 15.2 per cent in 1993 and 12.0 per cent in 2009. Meanwhile the rising confidence seen in the late 1990s coincided with a fall in the saving ratio to 4.7 per cent in 1999.
As Chart 2 shows, the easing of confidence since 2016 has coincided with a period where the saving ratio has been historically low. Across 2017 the saving ratio stood at just 4.5 per cent. In the first half of 2018 the ratio averaged just 4.2 per cent. While the release of the official figures for the saving ratio are less timely than those for confidence, the recent very low saving ratio may be seen to raise concerns. Can softer confidence data continue to co-exist with such a low saving ratio?
There are a series of possible explanations for the recent lows in the saving ratio. On one hand, the rate of price inflation has frequently exceeded wage inflation in recent years so eroding the real value of earnings. This has stretched household budgets and limited the amount of discretionary income available for saving. On the other hand, unemployment rates have fallen to historic lows. The rate of unemployment in the three months to August stood at 4 per cent, the lowest since 1975. Unemployment expectations are important in determining levels of buffer stock saving because of the impact of unemployment on household budgets.
Another factor that has fuelled the growth of spending relative to income, has been the growth of consumer credit. In the period since July 2016, the annual rate of growth of consumer credit, net of repayments, has averaged 9.7 per cent. Behavioural economists argue that foregoing spending can be emotionally painful. Hence, spending has the potential to exhibit more stickiness than might otherwise be predicted in a more uncertain environment or in the anticipation of income losses. Therefore, the reluctance or inability to wean ourselves off credit and spending might be a reason for the continuing low saving ratio.
We wait to see whether the saving ratio increases over the coming months. However, for now, the UK household sector appears to be characterised by low saving and fragile confidence. Whether or not this is a puzzle, is open to question. Nonetheless, it does appear to carry obvious risks should weaker income growth materialise.
Articles
Questions
- Draw up a series of factors that you think might affect consumer confidence.
- Which of the following statements is likely to be more accurate: (a) Consumer confidence drives economic activity or (b) Economic activity drives consumer confidence?
- What macroeconomic indicators would those compiling the consumer confidence indicator expect the indicator to predict?
- How does the diminishing marginal utility of consumption (or income) help explain why people engage in buffer stock saving (precautionary saving)?
- How might uncertainty affect consumer confidence?
- How does greater income uncertainty affect expected utility? What affect might this have on buffer stock saving?
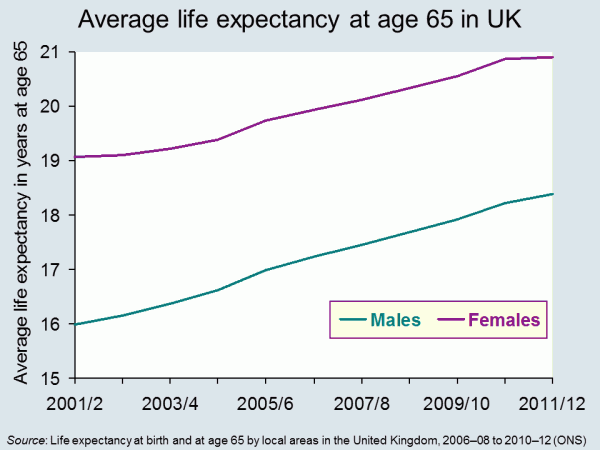 Life expectancy is increasing across the world and the latest set of figures from the Office for National Statistics show that in the UK it has passed 79 for boys born in 2010–12, and 82 for girls born then. In fact the prediction is that over a third of babies born in 2013 will live to more than 100. The data throws up some interesting questions. How well prepared are we for lives that last this long? And how evenly distributed is this increase in life expectancy? Pensions’ minister, Steve Webb, has called for better information on life expectancy to be shared. How would this impact on our decision making?
It seems reasonable to think that increasing life expectancy must be good news. And of course, for individuals it can be. In 1951 the average man retiring at 65, in England and Wales, could expect to live and draw a pension for another 12.1 years. By 2014 this had risen to 22 years.
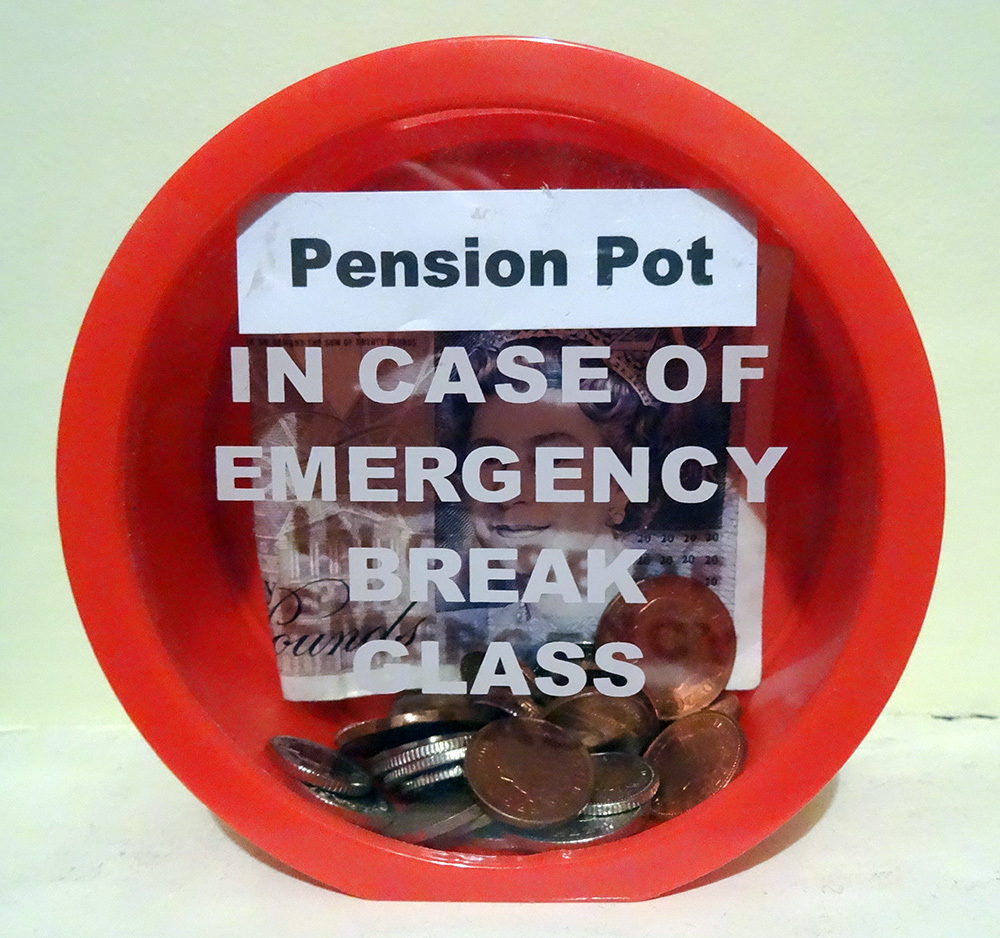
 But while we can look forward to longer life, for the government, it presents some challenges The first is that we just don’t save enough for our old age. This seems to be partly because we find it hard to make decisions that will have an impact so far in the future. There are a number of measures that have been put in place to encourage us to save more, including auto-enrolment into company pension schemes. This is being rolled out across businesses over the next three years. In the 2014 Budget, the Chancellor announced that people reaching retirement age will be able to draw all their pension as a cash lump sum, rather than having to take it as a regular income.
Another concern for government is the variations that we find in life expectancy across the UK. The 2014 ONS data identified that life expectancy for men born in Glasgow in 2012 is 72.6, in East Dorset it is 82.9. 25% of those in Glasgow are not expected to live to 65. The gap in years of good health is even greater. This presents governments with a long-term problem. How do they achieve greater equality in this instance? Do they focus resources on the areas that need it most? Do they legislate to address behaviour? Or do they rely on the provision of good advice – on diet, exercise and other factors?
Information has a role to play in both areas identified above. In April 2014, Steve Webb, suggested that in order to make good decisions at the point of retirement, people need to understand more about what lies ahead. He said:
People tend to underestimate how long they’re likely to live, so we’re talking about averages, something very broad-brush. Based on your gender, based on your age, perhaps asking one or two basic questions, like whether you’ve smoked or not, you can tell somebody that they might, on average, live for another 20 years or so.
This suggestion has led to some concerns being expressed at what appears to be an over-simplistic approach. Estimates can only be based on a mix of averages modified by individual information. Would the projections be shared with pension providers? What would you do if you exceeded your forecast life expectancy – by a long way – and had spent all your money? Could you sue someone?
Will your pension pot last as long as you will? The Telegraph, Dan Hyde and Richard Dyson (23/4/2014)
Scientists invent death test that will tell us how long we have to live Metro (11/8/13)
Games host Glasgow has worst life expectancy in the UK The Guardian, Caroline Davies (16/4/2014)
Pensioners could get life expectancy guidance BBC News Politics (17/4/14)
ONS reveals gaps in life expectancy across the UK FT Adviser Pensions, Kevin White (23/4/14)
Health care aid for developing countries boosts life expectancy Health Canal, Ruth Ann Richter (22/4/14)
A third of babies born this year will live to 100 This is Money.co.uk, Adam Uren (11/12/13)
Questions
- Thinking about the UK, what are the factors that might explain variations in life expectancy across different regions? How might the government address these differences? Why would they want to do so?
- Do the same factors explain variations between countries? Who can address these differences? Who would want to do so?
- If you could have a reasonable prediction of your life expectancy at 65, would you want it? How would your behaviour change if you were predicted a longer than average life expectancy? How would it change if you were predicted a shorter than average life expectancy?
- If you could have an accurate prediction of your life expectancy at 18, how would your answers differ? If this were possible, would it present any problems?
 In our blog How sustainable is UK consumer spending? we considered concerns of some commentators that consumer spending was growing unduly quickly given the absence of any sustained growth in disposable income. The Second Estimate of GDP, Q2 2013 reports that the economy grew by 0.7 per cent in the second quarter of the year, with household expenditure growing by 0.4 per cent.
Because household spending makes up about two-thirds of aggregate demand in the UK it is important to keep an eye on it. The latest figures show that the real value of consumer spending by British households has risen in each quarter since 2011 Q4. In other words, the volume of household purchases has risen for seven consecutive quarters. Over the period, the growth in real consumer spending has averaged 0.4 per cent per quarter.
 The chart helps to demonstrate the stark turnaround in the growth in consumer spending. Over the period from 2008 Q1 to 2011 Q3, real consumer spending typically fell by 0.4 per cent each quarter. As we noted in our previous blog, this was a period when the global financial system was in distress, with the availability of credit severely dampened, but also a period when households were concerned about their own financial balances and the future prospects for growth. Over the same period, real GDP typically fell by a little under 0.3 per cent each quarter. (Click here to download a PowerPoint of the chart.)
The real value of consumer spending has yet to return to its 2007 Q4 peak (£242 billion at 2010 prices). In 2013 Q2 the real value of consumer spending is estimated still to be 3 per cent below this level (£235 billion at 2010 prices). These figures are mirrored by the economy at large. Real GDP peaked in 2008 Q1 (£393 billion at 2010 prices). Despite the back-to-back quarterly increases in real GDP of 0.3 per cent in Q1 and 0.7 per cent in Q2, output in 2013 Q2 (£380 billion at 2010 prices) remains 3.2 per cent below the 2008 Q1 peak.
While real consumption values are below their 2007 Q4 peak, the concern is whether current rates of growth in consumer spending are sustainable. In particular, should this growth cause the household sector financial distress there would be real pain for the economy further down the line. Some commentators argue that the latest GDP figures are consistent with a more balanced recovery. In Q2 economic growth was supported too by other parts of the economy. For instance, we saw a 3.6 per cent rise in export volumes and a 1.7 per cent rise in gross fixed capital formation (i.e. investment expenditure).
Nonetheless, it is the protracted period over which consumer spending has been growing robustly that concerns some economists. Hence, we will need to continue to monitor the growth in all components of aggregate demand and, in particular, changes in household consumption, income, saving and borrowing.
Data
Second Estimate of GDP, Q2 2013 Dataset Office for National Statistics
Articles
New articles
UK economic growth revised up to 0.7% BBC News, (23/8/13)
UK GDP revised up to 0.7pc in second quarter: reaction Telegraph, (23/8/13)
UK rallying faster than thought as exports leap boosts GDP Independent, Russell Lynch and Ben Chu (24/8/13)
UK economy expanding faster than first thought, GDP revision shows Guardian, Heather Stewart (23/8/13)
Growth upgrade points to ‘sustainable’ recovery Telegraph, Philip Aldrick (23/8/13)
Previous articles
UK wages decline among worst in Europe BBC News, (11/8/13)
Squeezing the hourglass The Economist, (10/8/13)
UK first-quarter growth unchanged BBC News, (28/5/13)
Summer heatwave triggers shopping spree in ‘Wongaland’ economy Telegraph, Steve Hawkes and Steven Swinford (15/8/13)
Retail sales data better than expected as UK economy enjoys summer bounce Guardian, Heather Stewart (15/8/13)
Mark Carney is banking on you to keep spending Telegraph, Philip Aldrick (10/8/13)
NIESR upgrades UK economy but warns on consumer spending Telegraph, Philip Aldrick (2/8/13)
Consumers ‘expect better economy’ Belfast Telegraph, (4/8/13)
Questions
- Explain what you understand by a ‘sustainable’ economic recovery.
- What are the expenditure components that make up Aggregate Demand?
- Explain what you understand by consumption smoothing.
- Why would we would typically expect consumption growth to be less variable than that in disposable income?
- Would we expect consumption growth to always be less variable than that in disposable income? Explain your answer.
- What impact do you think the financial crisis has had on consumer behaviour?
- To what extent do you think the current growth in consumer spending is sustainable?
- How important are expectations in determining consumer behaviour?
Household spending makes up about two-thirds of aggregate demand in the UK. Understanding its determinants is therefore important to understanding short-term economic growth. The real value of consumer spending by British households has risen in each quarter since 2011 Q4. Over the same period real disposable income has flat-lined. This suggests that the British household sector has stepped up attempts to smooth their longer-term spending profile despite the current absence of growth in their real incomes.
When viewed over many years, disposable income and consumer spending grow at very similar rates. After stripping out inflation we find that over the past 50 years both have grown at about 2½ per cent per annum. However, if we measure growth from one quarter of the year to the next we tend to find that consumption growth is less variable than disposable income. This is known as consumption smoothing.
 Chart 1 shows the quarterly percentage change in consumption and disposable income since 1998. (Click here to download a PowerPoint of the chart).The variability in the disposable income series is generally greater than that in consumption so helping to illustrate consumption smoothing.
Consumption smoothing is facilitated by the financial system enabling us to either borrow to supplement our spending or to save to enjoy more spending in the future. The financial system can help households to avoid large variations in their spending over short periods.
Consumption smoothing does not prohibit falls in consumption nor periods when it is more variable than income. Over the period from 2008 Q1 to 2011 Q3, real consumption typically fell by 0.4 per cent each quarter while disposable income was flat. This was a period when the global financial system was in distress. Sharp contractions in credit meant that the financial system was no longer able to support economic activity as it had previously. Furthermore, households too looked to repair their balance sheets with economic uncertainty acting as an incentive to do so.
What is interesting is the extent to which British households are spending again. Since 2011 Q4 the real value of spending has typically expanded by 0.4 per cent each quarter while income growth remains largely absent. One might argue that this just demonstrates a willingness for households to engage in consumption smoothing. With credit conditions still tight, the growth in spending has been aided by a decline in the saving ratio.  This can be seen from Chart 2.
In 2009 Q2 the proportion of income saved hit 8.6 per cent having been as low as 0.2 per cent in 2008 Q1. In 2013 Q1 the saving ratio had fallen back to 4.2 per cent. (Click here to download a PowerPoint of the chart.)
It is of course all too easy to over-interpret data. Nonetheless, there be will concern if households look to maintain consumption growth at rates substantially greater than those in disposable income for too long a period of time. Consumption smoothing could become a real problem for future economic activity if it was to result in a financially distressed household sector. Hence, an important question is the extent to which current rates of consumption growth are sustainable. Future consumption and income trends will therefore be analysed with enormous interest.
Data
Quarterly National Accounts, Q1 2013 Dataset Office for National Statistics
Articles
UK wages decline among worst in Europe BBC News, (11/8/13)
Squeezing the hourglass The Economist, (10/8/13)
UK first-quarter growth unchanged BBC News, (28/5/13)
Summer heatwave triggers shopping spree in ‘Wongaland’ economy Telegraph, Steve Hawkes and Steven Swinford (15/8/13)
Retail sales data better than expected as UK economy enjoys summer bounce Guardian, Heather Stewart (15/8/13)
Mark Carney is banking on you to keep spending Telegraph, Philip Aldrick (10/8/13)
NIESR upgrades UK economy but warns on consumer spending Telegraph, Philip Aldrick (2/8/13)
Consumers ‘expect better economy’ Belfast Telegraph, (4/8/13)
Questions
- Explain what you understand by consumption smoothing.
- Why would we would typically expect consumption growth to be less variable than that in disposable income?
- Would we expect consumption growth to always be less variable than that in disposable income? Explain your answer.
- What impact do you think the financial crisis has had on consumer behaviour?
- To what extent do you think the current growth in consumer spending is sustainable?
- How important are expectations in determining consumer behaviour?
 A crucial determinant of the economy’s short-term prospects is the appetite of households for spending. This is because household spending makes up roughly two-thirds of the total demand for firms’ goods and services or two-thirds of what economists refer to as aggregate demand. So what are the latest forecasts for consumer spending? We briefly consider the forecasts of the Office for Budget Responsibility for consumer spending and, in doing so, update an earlier bog Gloomy prospects for spending in 2012?
In its March 2012 Economic and Fiscal Outlook the Office for Budget Responsibility presents it forecasts for economic growth and household spending. The following table summarises these forecasts.
OBR Forecasts (annual real percentage change)
|
2012 |
2013 |
2014 |
2015 |
2016 |
| GDP |
0.8 |
2.0 |
2.7 |
3.0 |
3.0 |
| Consumption |
0.5 |
1.3 |
2.3 |
3.0 |
3.0 |
| Disposable income |
–0.2 |
0.5 |
1.9 |
2.4 |
2.5 |